The bands and alphas

Contents
Three sections of data are found at the end of a Statsf report.

The bands summarize item difficulty and discrimination figures for cognitive tests (there are also bands for affective measures -- please see the next topic).
In this example, most items had difficulty values (proportion correct) lying between 0.40 and 0.60. Four items had difficulties above 0.60 but less than 0.70. One item, Q5, had a difficulty greater than 0.70, while another, Q22, had difficulty less than 0.10.
Item discrimination values are interpreted in the same manner. For this test, only five items (Q4, Q22, Q5, Q14, and Q24) had discrimination values below 0.40.
Item discrimination figures may be negative. When this happens such items will appear in the .00 band.

The last table in a Statsf report indicates how the value of coefficient alpha would change if an item were removed from the test.
In this example, with all 25 test items, the value of alpha is .9149.
If Q1 were removed, alpha would decrease by -0.006, becoming 0.909. Since higher alpha means greater reliability, we would not want to drop Q1 from the test.
However, the situation with Q4 is different. Were we to eliminate it from the test, alpha would increase to 0.917. This might be cause to question the inclusion of this item the next time the test is used.
There is a relationship between item discrimination and the value of coefficient alpha. Items with discrimination figures above 0.30 can generally be counted on to boost alpha. Items with lower discrimination values may, on the other hand, serve to bring alpha down.
Related tidbit:
This set of CCs lines could be used to compare the reliability of the whole 25-item test with that from the same test with Q22 excluded (or eliminated):
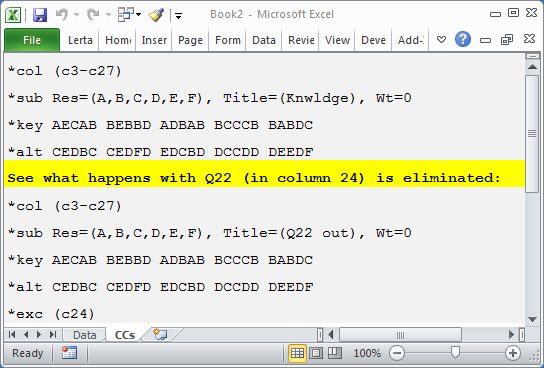
There are two subtests defined by these lines (remember that the *col lines mark the start of subtest definitions).
A *exc line has been used to exclude the item responses found in column 24 (c24) of the Data worksheet. This was Q22 in this example.
The Stats2f report corresponding to the second subtest looked like this after Elmillon was run:
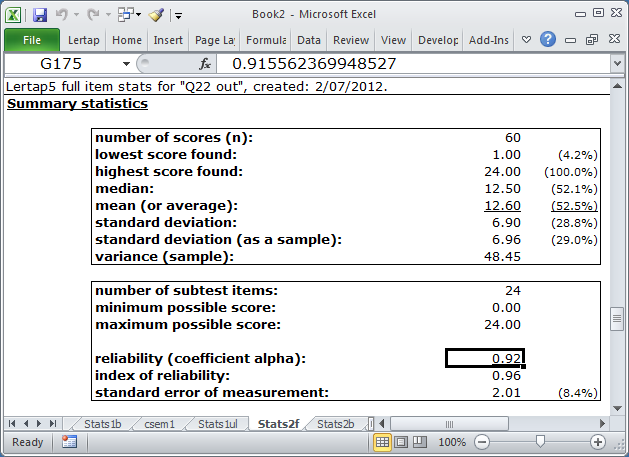
With 24 subtest items, coefficient alpha has the unrounded value seen in the Formula Bar (0.91556 ....).
We could have also excluded Q4, found in c6 of the Data sheet pertaining to this example, by using *exc (c6, c24).
Related tidbits:
You will no doubt have noticed the Wt=0 settings on the *sub lines seen above? Whenever the CCs lines reference more than one subtest, Lertap is inclined to make a total score by adding up the subtest scores. This "Total" score will then appear in the Scores worksheet. To keep a subtest out of the total score, Wt=0 is used. If all subtests have Wt=0, then the total score will not be made.