Unidimensional response charts

Contents
![]() If you have a Stats1b-style report active, clicking on this icon will produce charts such as the one pictured below:
If you have a Stats1b-style report active, clicking on this icon will produce charts such as the one pictured below:
Lertap's item response charts are made by Excel. They may be copied and pasted to any other application, such as Word. They may also be extensively reformatted -- for help on this, please refer to Excel Help.
The response "labels" showing at the bottom of the chart are as found at the top of a Stats"b" worksheet. Here's a snapshot showing the top of a typical Stats"b" worksheet:
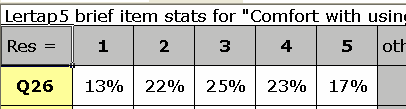
These response labels may be changed. If they are, the change will carry through to the item response charts.
For example:

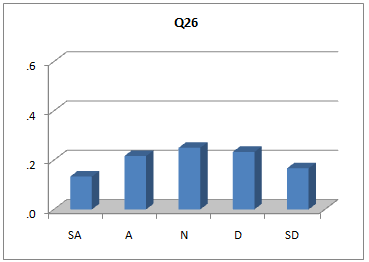
Note how the original response labels of {1 2 3 4 5} have been changed to {SA A N D SD}? Look at what happens when item response charts are requested now:
Lertap places item response charts in new worksheets, having names such as Stats1bCht and Stats2bCht.
Item response charts are briefly discussed in Chapter 10 of the manual (page 172 in the printed manual). An example suggesting how item response charts for different groups of test takers may be obtained is provided in Chapter 8 of the manual (pp. 130-133 in the printed manual).
Response charts of this type differ a bit, depending on the nature of the responses; if they are from an affective instrument with Likert-style items, the charts will be similar to the ones seen above. (Likert items typically use strongly agree to strongly disagree response options.)
For cognitive items, response charts will resemble the one shown below:
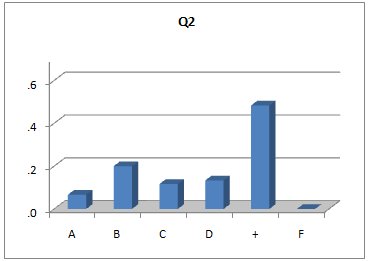
The correct answer to Q2, E, has been replaced by a + sign in the picture above (a definite plus, wouldn't you say?).
Note that problems can arise when creating these charts -- the number of charts which Excel can make is limited, as is the number of fonts which a workbook may have (the charts sometimes use a variety of fonts). These problems are more likely to appear when quintile plots are made from a Stats1ul report; the following topics provide more details.