Reports

Contents
A sample of the output seen in Lertap's Freqs report is pictured here:
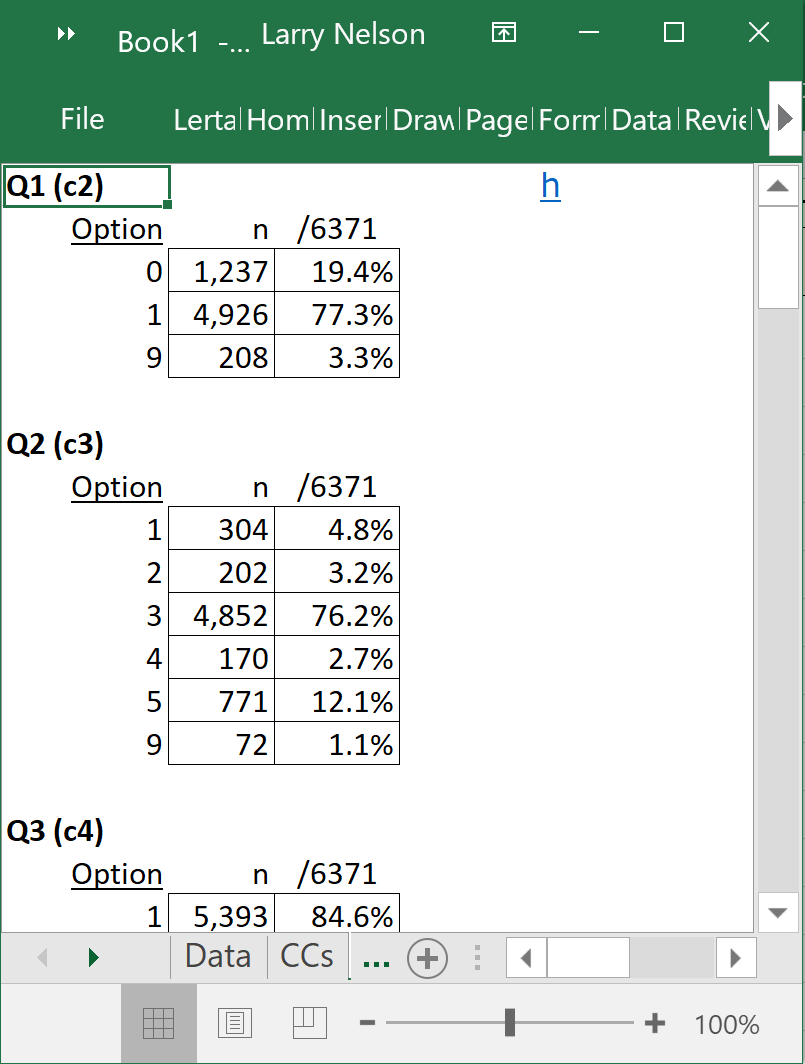
The first question, Q1, was a supply item (also known as a "constructed response" item). A response code of 0 (zero) indicates an incorrect answer, 1 was the code used for a correct answer, 9 was used to code non responses: 208 of the students failed to answer Q1.
The second question, Q2, was multiple-choice, with 72 students failing to answer it. It is curious that almost three times as many students failed to answer Q1 when compared to Q2 unless we consider guessing as a factor (Q1 was a much easier item but not multiple choice).
The Stats1b snippet below displays results for the initial five items; Q5 was very difficult for the students, with 9% (over 500 students) of them deciding to leave the question unanswered.
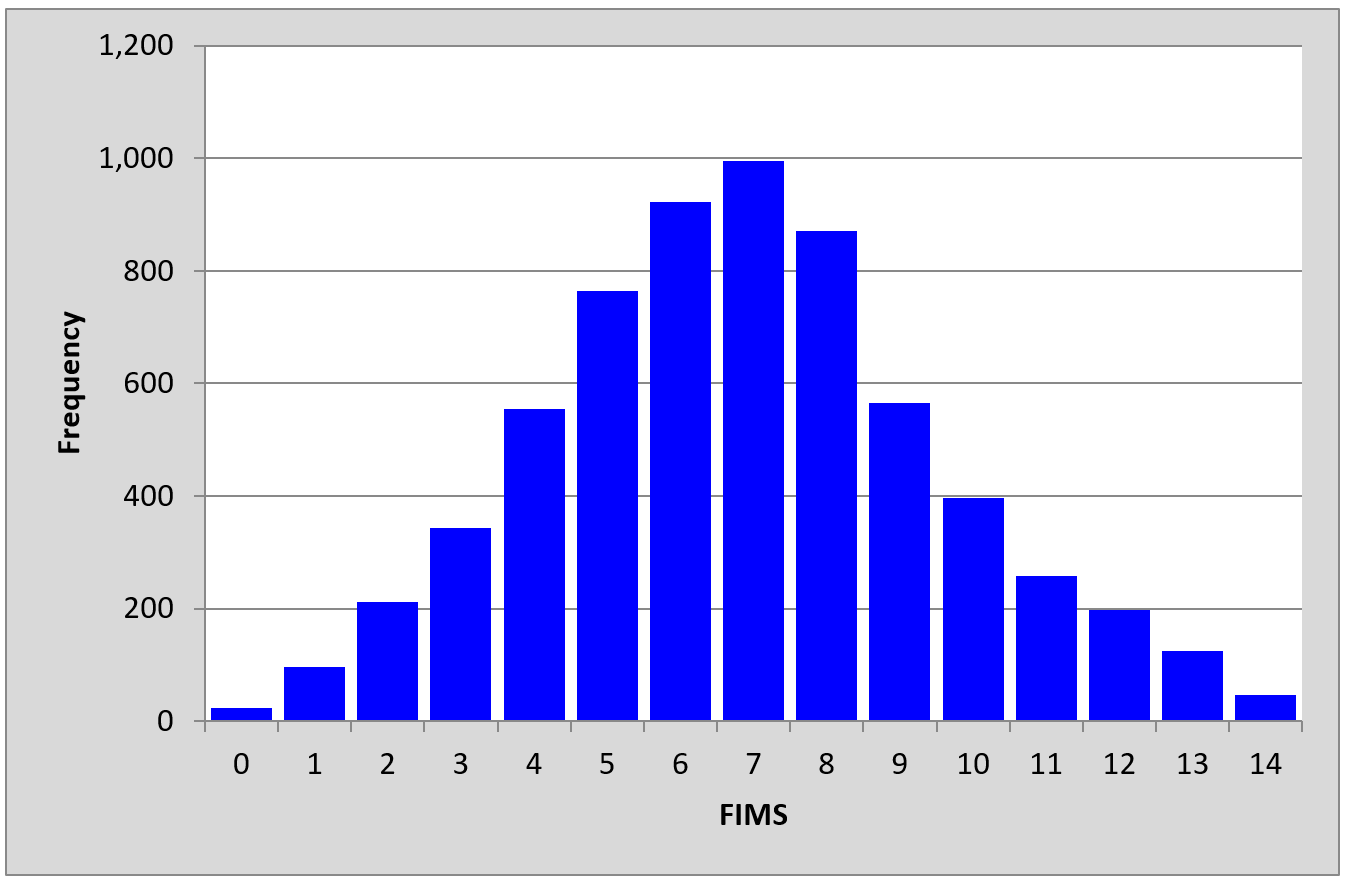
A histogram of the scores is shown below:
A variety of interesting research questions might be begging for answers.
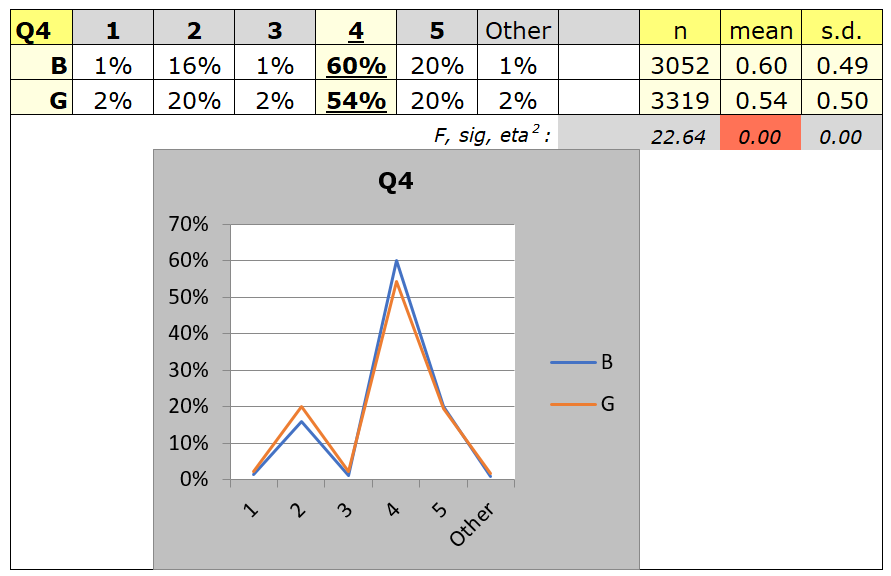
Were there gender differences? This might be answered at two levels: the overall score level, and the item level. The plot below compares boy and girl responses on Q4. The boys did better on this item with 60% getting it correct compared to 54% of the girls -- these percentage figures are underlined to indicate that they correspond to the keyed-correct answer (which was option C in the original test).
Note that all students from both countries are included in the plot below. The next page provides the opportunity to look for gender differences within each country.
Note: there's an anomaly in Excel and Lertap 5 which requires that nominal variables use non-numeric codes. This made it necessary to recode the data in column 1 of the Data sheet, mapping an original code of 1 to a new code of G, while the original code of 2 was mapped to B. This is easy to do using a special Lertap 5 option. The recoded gender column is called "GenderA".
Quite a number of students thought that the second option, B (coded as 2), was the best answer on Q4. It would be best to check the Stats1f report to get the complete lowdown on this item:
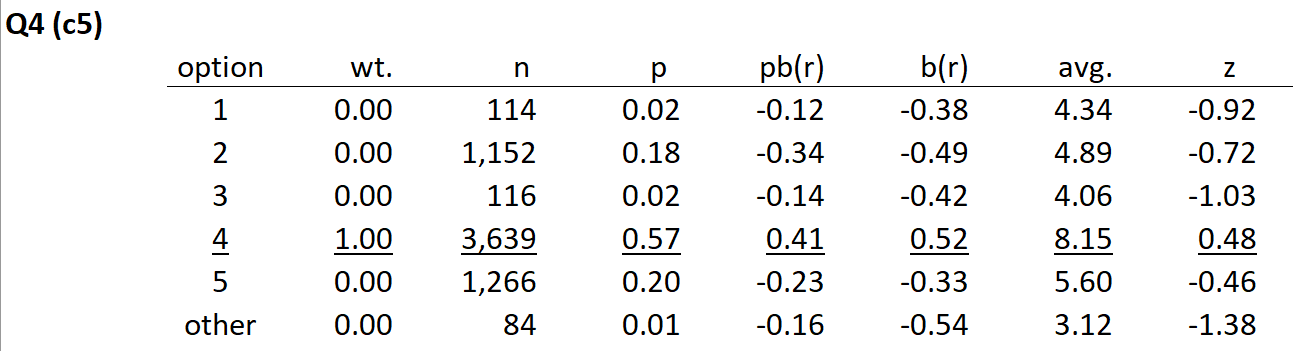
The Stats1f summary for Q4 indicates that the second option, B, was a functioning distractor. The 1,152 students who chose this option were weak students: their overall test score average (avg.) was 4.89, much less than the average of 8.15 rendered by those who selected the fourth option, D. We could (and would) say that Q4 was a "discriminating item", one which performed quite well in this administration of the test.
The box plot below indicates that the boys and girls had the same median test score (7), with the girls' scores showing a greater range, and a more symmetric distribution.

What about country-level differences? Over years of international testing, Japanese students have often had superior mathematics test scores. Was that the case here with the FIMS data? Try to find out by downloading the dataset using the next page. (The country variable is coded in two ways in the Data sheet; use column 16 to answer this question.)