A university admissions screening test: La Florida

Contents
Here's a 50-item screening test, used by a large South American engineering faculty to assist with the task of picking the strongest applicants from an over-abundance of erstwhile, would-be freshman students.
More than 11,000 applications were received by a faculty with space for 500 first-year students.
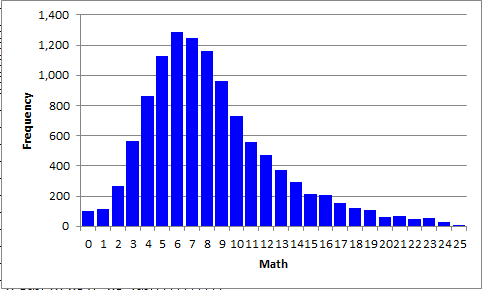
As part of the screening process, all applicants were required to sit a test intentionally designed to be difficult, even perhaps a bit intimidating. It started with 25 mathematics items, followed by 25 physics items ("fisica"). Students had to have a score of at least 50% to pass the test.
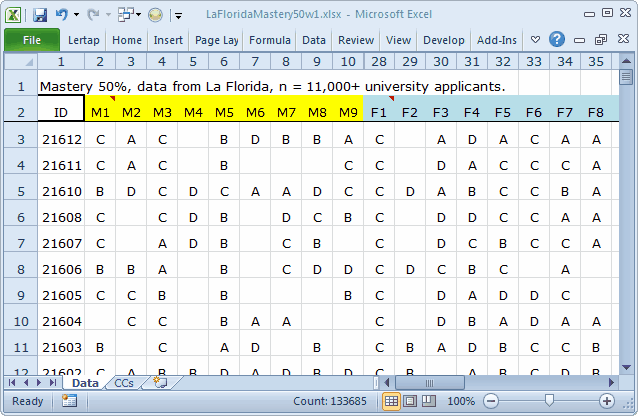
Note that columns 11 through 27 of the Data worksheet have been hidden in the screen snapshot above. This was to make the start of the physics items clearer: they begin in the 28th column.
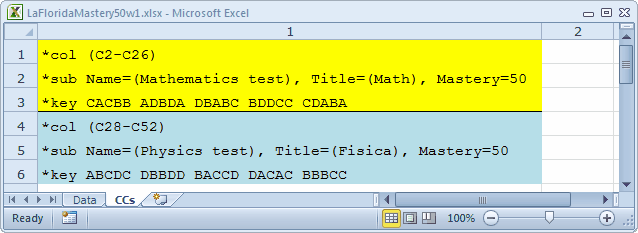
Each *col line in the CCs sheet marks the definition of a subtest. This CCs worksheet defines two subtests. The first has item responses starting in column 2 (C2) of the Data worksheet, going out through C26. The item responses for the second subtest, "Fisica", begin in C28, extending out to C52.
How did we get results? You mean you don't know by now! We took a few steps.
2) Use the Interpret option on the Lertap tab.
3) Use the Elmillon option on the Lertap tab. |
|
It took our MacBook Pro running Windows 7 and Excel 2010 four and a half minutes to work through Lertap's Interpret stage. When there's more than one subtest (here we have two), Interpret may pause after it has run through the items belonging to a subtest if it finds "strange" characters for item responses. It did it with La Florida. A scanner was used to process the item responses from mark-sense sheets; unanswered questions were "recorded" as blanks in the scanner's data file, while uninterpretable, "strange", answers were recorded as asterisks. (A typical uninterpretable response occurs when students shade in more than one bubble for an item on their answer sheets, effectively giving more than one answer to the item.)
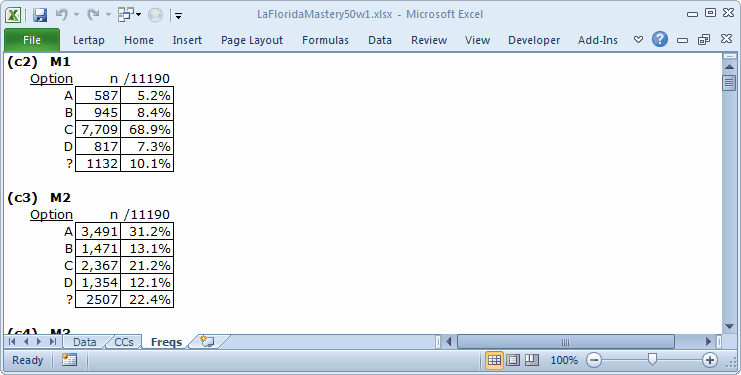
The ? row in a Freqs table includes both "strange" responses and blanks. All of the items in both subtests had large entries in the ? row. See for yourself: download this workbook, and have a go.
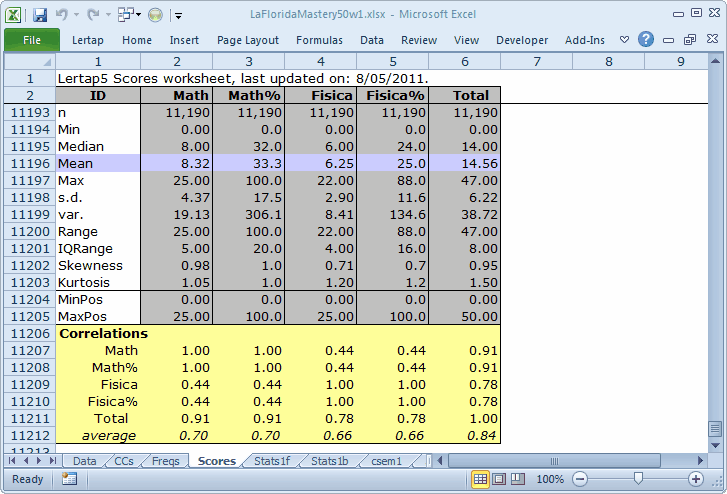
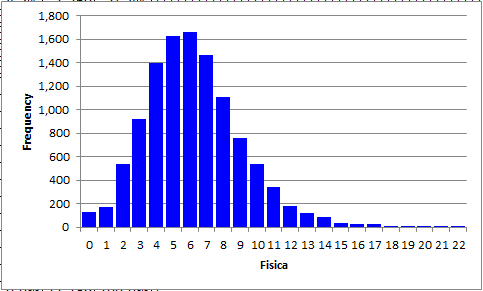
We told you these were difficult tests. The median score for Math was just 8.00, or 32.0%. It was even less for Fisica.
The median total score, Math + Fisica, was 14.00, just 28% of the maximum possible of 50.00.
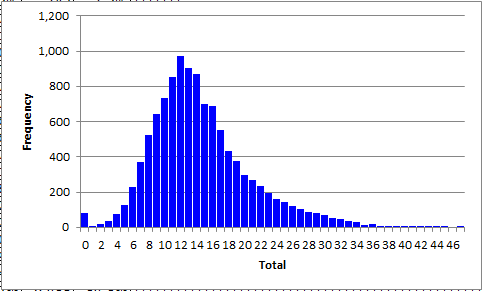
All of these histograms were made by Excel, working under the loving guidance of Lertap. For a reminder of how to get works of art like these, click.
Continue to the next topic for a discussion of results.