MathsQuiz: a simple, 15-item cognitive quiz

Contents
This little example is a nifty one.
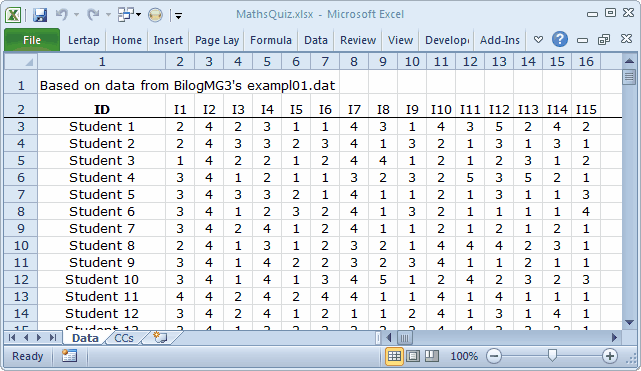
About 1,000 high-school students responded to a short maths quiz, a test with just 15 items.
Each item used four responses, 1 2 3 4.
Snippets from the Data and CCs worksheets are shown below:
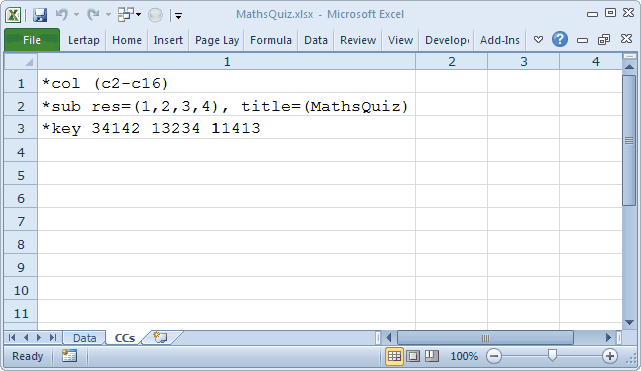
Did you notice the *sub line above? When the options for a cognitive test, called "response codes" in Lertap, are not A B C D (the default response codes for cognitive items), then an res= specification has to be made, and the *sub line is where it goes. Compare this *sub line with that not found in the ChemQuiz example. ChemQuiz does not need res= as its items use the default response codes for cognitive items.
(For affective items, the default response codes are 1 2 3 4 5.)
2) Use the Interpret option on the Lertap tab.
3) Use the Elmillon option on the Lertap tab. |
|
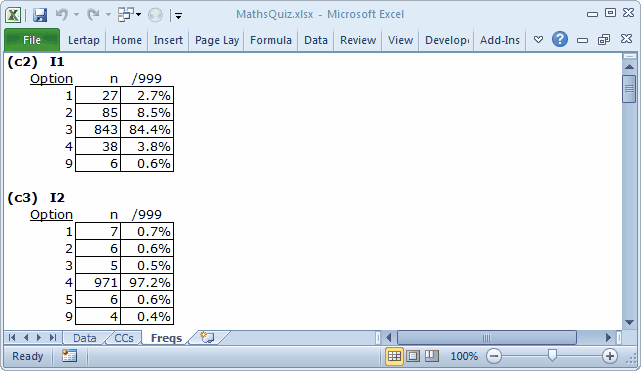
Results were obtained by completing the three basic Lertap steps. Contents of selected "reports" (worksheets) are shown below:
The data in this sample are from one of the datasets distributed with the Bilog-MG3 system; they're probably quite dated -- it's likely to be the case that the data were processed many moons ago.
So it is that we can only guess at the meaning of a "response" of 9. Almost all of the items had 9s; they probably indicate missing or bad data. But what about a "response" of 5? The results in the Freqs report indicate that 6 students appeared to select option 5 on the second item, I2, whose responses are found in column 3 (c3) of the Data worksheet.
Of course, there wasn't really a fifth option. It could be that mark-sense answer sheets were used to collect student responses, and then scanned. It could be that the mark-sense form allowed for five responses per item, even though only four were used on the actual test. This being the case, a response of 5 would be an error, and, were that true, 5s would be the same as 9s.
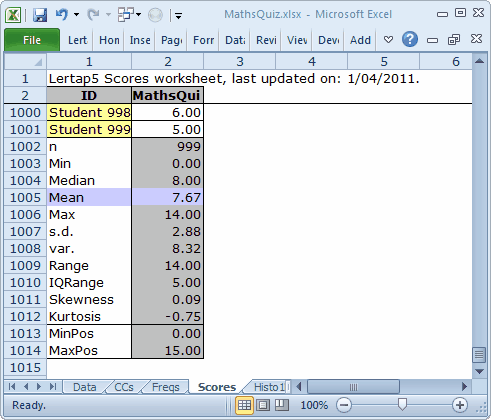
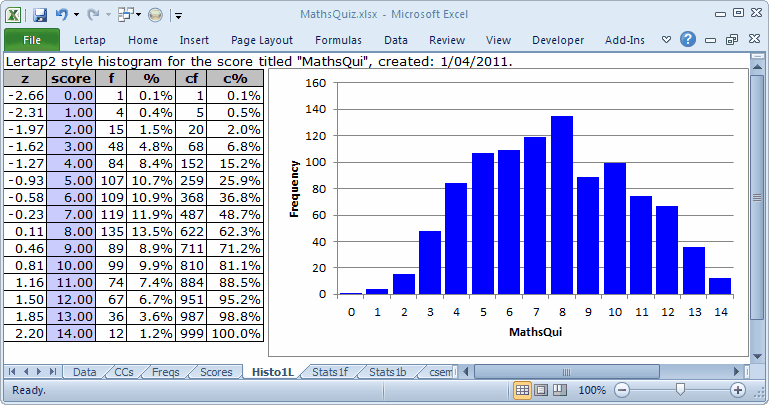
The students' scores were quite spread out, as seen above. "MaxPos", the maximum possible score, was 15, but "Max", the highest test score achieved was 14, as shown in the Scores report. At this point it seems that no-one got a perfect score.
Now, in answer to those 12 people who raised their hands to ask about the score's title showing as "MathsQui", when, according to the CCs sheet it's "MathsQuiz": the reason for the truncated title is that titles are limited to a length of just 8 characters. If title= is not used on the *sub line, then Lertap invents a title; usually it will be "Test1".
Even more people are asking about the Histo1L worksheet whose contents are portrayed immediately above. They're right to ask, too, as a Histo1L "report" does not result from following "The 3 steps". It's an extra. The way to get it is mentioned here.
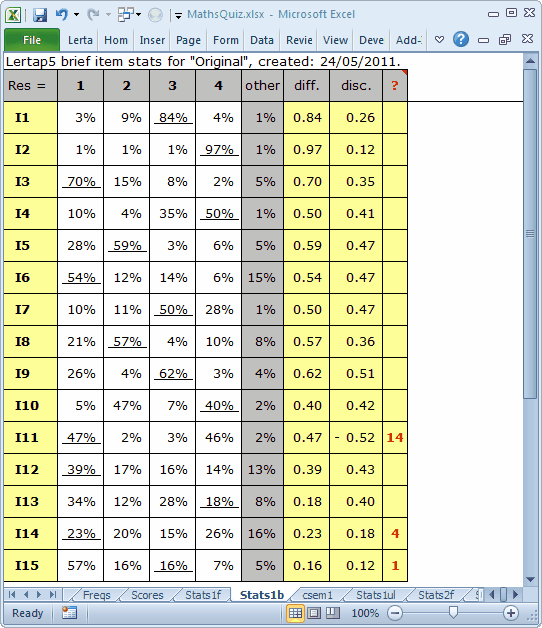
Okay? What to look at next? Actually, after the 3 steps have completed, Lertap automatically gets Excel to set its focus on the Stats1b report. It does this because we (at Lertap HQ) reckon that the Stats1b report is the one most users are most anxious to see. So, let's look at Stats1b. Here's the top part of Stats1b for this little quiz:
How to make use of these results? The answer depends on why we created and used the test to begin with.
If we're one of the maths teachers who used this little test, we might simply want to see where the students had a tough time. We might, for example, look for items where less than 50% of the students were able to identify the right answer. Then we'd focus on the subject content targeted by these items, and review it in class.
In this case, that would be I10 (40% correct), I11 (47%), I12 (39%), I13 (18%!), I14 (23%), and I15 (16%!).
We might also take into account items where quite a few students had an "other" response, that is, did not choose one of the four options, 1 2 3 4. This would add I6 (15% other) to the mix.
Fair enough. The only potentially naive problem with this idea is that it assumes we have scored the items correctly, which is the same as saying that we didn't make an error when we entered the correct answers on the *key line in the CCs worksheet.
The ? column will often (but not always) let us know if an item has been incorrectly keyed. Three items have an entry in the ? column in this case: I11, I14, and I15. Of these, I11 was indeed incorrectly keyed: the right answer to this item was 4, not 1.
We will have more to say about the ? column below.
Here's the bottom part of the Stats1b report:
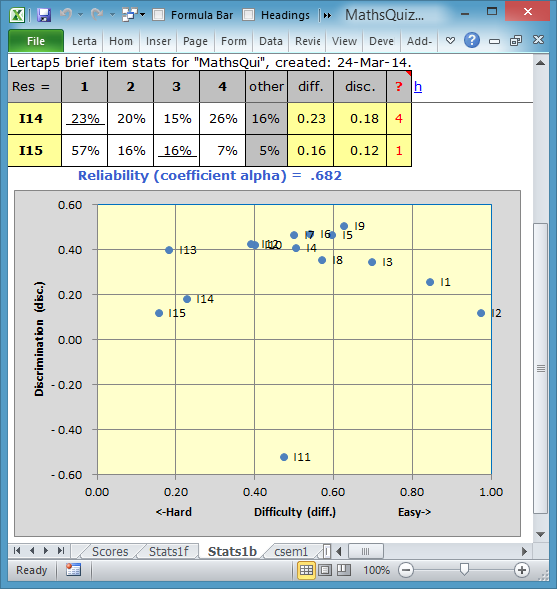
The information in this scatterplot comes directly from the "diff." and "disc." columns of the Stats1b report. I15 has a diff. value of 16%, or, as a proportion, 0.16. Its disc. value is 0.12.
"diff." means item difficulty. "disc." means item discrimination.
"diff." is easy to interpret: it's the proportion of students who correctly answered the item. Easy items have diff. values above 0.80, which would be I1 and I2 here. Difficult items will have diff. values less than 0.20, items I13 and I15 in this example.
Many many hands are now waving in the air: "You mean to say that difficult items have low diff., while easy items have high diff.?"
Yes. Unfortunately diff. is a misnomer. Some authors have suggested that diff. should be called the facility index, but they have not held sway.
The maximum possible value for diff. is 1.00, corresponding to a percentage of 100%, something which happens when all students get an item right.
What about "disc."? It's a measure of how an item discriminates. If the most capable students get the item correct, while the least capable do not, the item is said to be discriminating. Such items are wanted when the purpose of the test is to identify the "best" students.
There are different ways to index item discrimination. A thorough discussion may be found in Chapter 7 of the Lertap manual (Nelson, 2000). Assuming you've read that chapter, you know that the disc. value displayed in Stats1b is the correlation between the item score and the criterion score, which is usually an internal one, being the number of the other items which the student got correct (it is possible to use an external criterion too). In this example, a common one, the items are scored on a right-wrong basis, with one point for the correct answer, zero points otherwise. This is called "dichotomous" scoring. The correlation between a dichotomous variable and an interval variable is generally referred to as a "point-biserial" correlation, abbreviated in Lertap Stats1f reports as "pb(r)", and referred to as "disc." in Stats1b reports.
Okay? Back to the ? column: one or more of an item's options will appear in the ? column whenever one of these conditions is met: no-one selects the option, the option is the correct answer but was selected by students with below-average criterion scores, or the option corresponds to a distractor (an incorrect option) selected by students with average or above-average criterion scores. The idea here is (basically) that we want an item's correct option to be selected only by the strongest students, while each of the distractors is selected by less than average students. Note that it is often the case that there will be many items with entries in the ? column when the number of students who take the test is small, say less than 50 or so. When there aren't many students, an item with four or more options will very frequently have "dead" distractors, wrong answers which were not selected by anyone; these will show up in the ? column.
If a test is meant to discriminate, its items will have very few entries in the ? column, and no items with negative disc. figures. Such tests will more often than not have good reliability, a subject which leads to the next topic: the Stats1f report.