Printing results

Contents
Excel has good to very good printing capabilities, and these days it seems easier than ever to pick up something in Excel and paste it into Word or PowerPoint.
Let's start with Lertap's Stats1b report, with a thought to printing.

The Stats1b report is one of the easiest to print. How? Well, as per usual, right? Go to File, and select Print. Of course.
But Stats1b can go on for many lines, more than what will fit on a single printed page. What if you wanted to control where pages break?
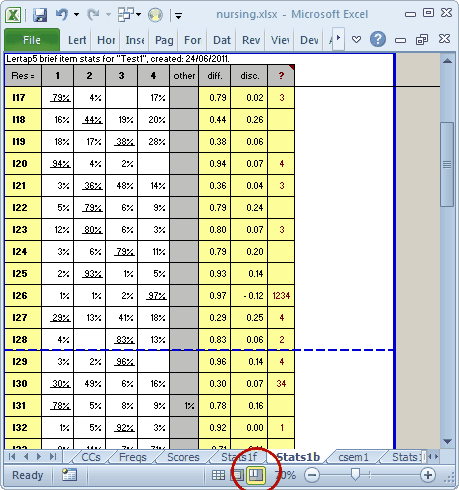
Click on the page-break icon, circled in red. Then just drag the dotted line to where you want the break to be. Neat (Excel has worked this way for many years, but it hasn't always been so easy to get page breaks to show).
Now, as easy as this is, there's going to be a small problem. In this case, the page break is going to come after I28. The next page will begin with I29's results, but there won't be any column headers.
It would be nice to have Lertap's first two rows carry over to every printed page, wouldn't it? That way we'll have the column headers, and we won't have to dart back to the first page to remember which column has diff. values, and which has disc. figures.
Not hard to do.
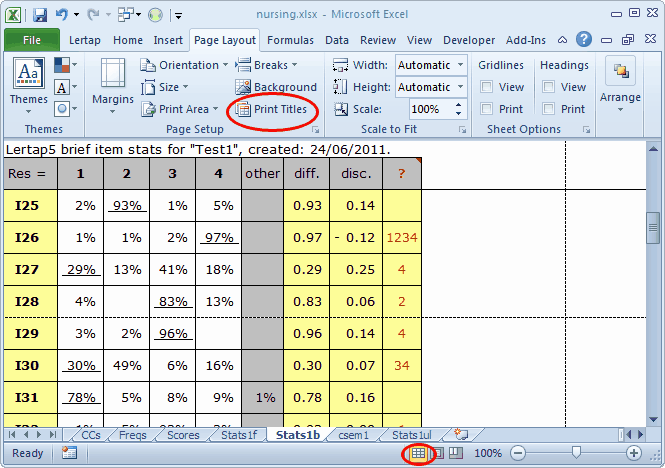
Make sure that the view has switched back to normal (small red circle at bottom). Then, on the Page Layout tab, click on Print Titles.

And that'll do it. Every printed page will now have headers from Stats1b's first two rows, R1:R2.
The Stats1f report, and also the Stats1ul report, are similar to Stats1b in that they're rather amenable to printing, even though they are substantially more verbose than Stats1b.
But there are many other Lertap reports which might have several rows of information above the bits which we really want to print.
Among these would be, for example, the Scores report, and Breaks1bw. See the next topic for comments on how to print these.