Using Lertap RSA in Uni Class A
An extensive discussion of "RSA", the response similarity analysis tool in Lertap 5, is available here.
Use of this tool requires that row 25 of Lertap's System worksheet be set to "yes":
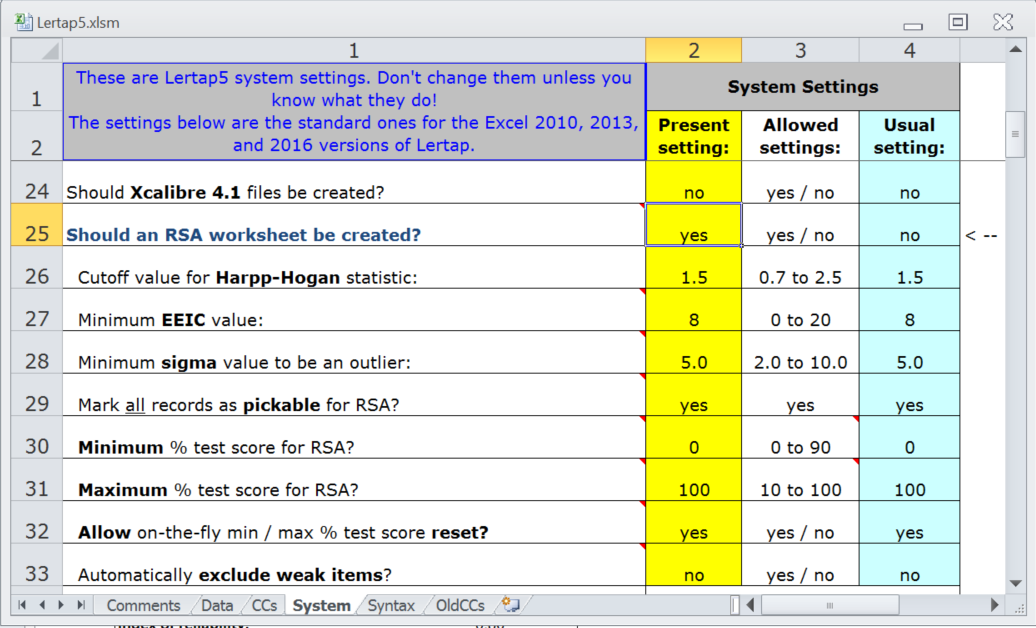
There are no less than eight rows in the System worksheet pertaining to the use of RSA, rows 26 to 33, as seen above. It is recommended that these default settings be used in almost all cases.
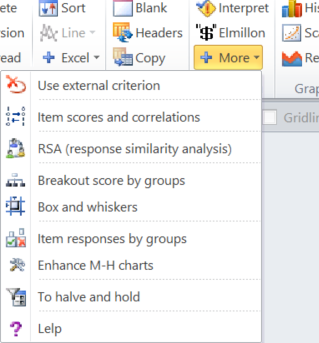
Let's get rolling ... the first step is to use the "Item scores and correlations" option from the Run menu:
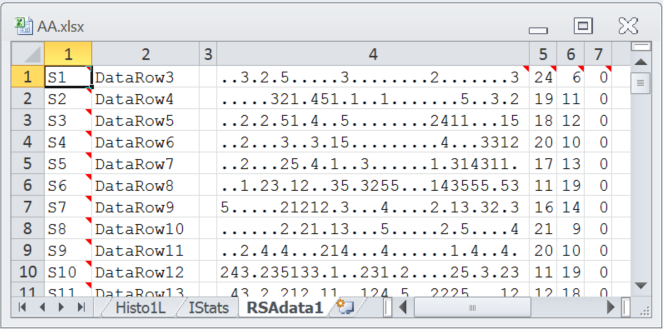
Two new worksheets will be created, "IStats" and "RSAdata1". The snapshot below indicates the formatting of the RSAdata1 worksheet; as you look at this display, keep in mind that correct answers are indicated by "."; the other entries in each line indicate the distractors selected by students. Student S1 got the first two items right, selected option 3 (a distractor) on the third item, got the next item right, then selected option 2 on the fifth item, and so on. The 24 in column 5 is the number of items answered correctly by student S1. The 6 in the next column is this student's number of incorrect answers; the seventh column indicates the number of questions skipped (unanswered) by each student.
At this point, some experienced users might get a fresh cup of coffee, turn off their phones, clean their glasses, and slowly scroll down the RSAdata1 worksheet. There are times when a bit of "hanky-panky" can be spotted by doing just that -- suddenly there will at times be blocks in column 4 which stand out, with response patterns almost suspicious in and of themselves.
Look, for example, at the screen snapshot below, an excerpt from a 44-item test taken by some 2,500 students:
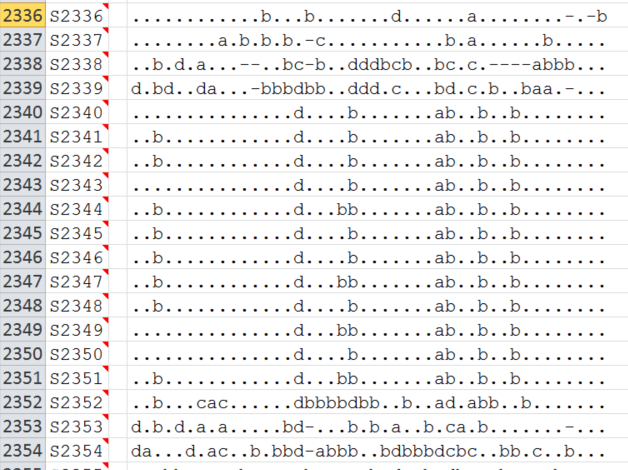
There's a suspicious block above, starting with S2340. We might not require any sort of sophisticated analysis here -- we would be unable to categorically state that the students in this block colluded, but to some readers (probably many), hanky-panky would indeed seem to be present.
But let's come back to the results from "Uni Class A". We've taken the "Item scores and correlations" option and an RSAdata1 worksheet is on hand.
We can now take the "RSA (response similarity analysis)" option from the Run menu. It produced the following message as it got underway:
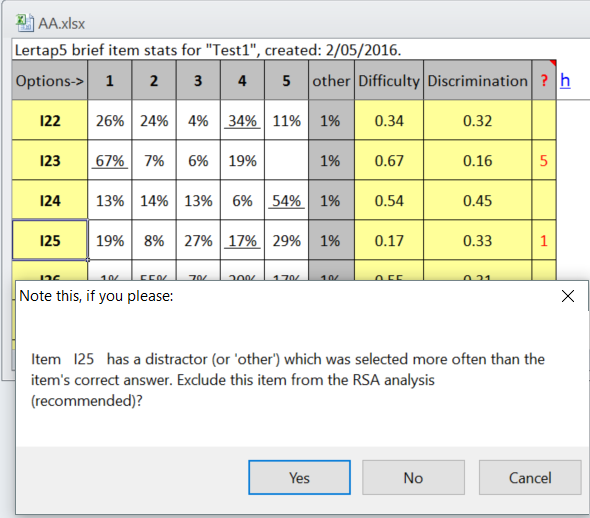
The recommended application of Lertap's RSA routine involves weeding out those items where one or more of the distractors is found to be more popular than the correct answer. This has happened here with I25: 17% of the students selected option 4, the correct answer, but more students opted for almost all of the other options. We take "Yes" to exclude this item from the analysis. Ditto for I29.
The RSA routine will ask for the range of scores to use in its analysis. This will usually be from the minimum possible test score to the maximum possible test score (but in some cases it might be desirable to work within a smaller range of scores).
It took our laptop computer with an i5 processor 29 seconds to compete the RSA analysis.
It found one pair of students to have item responses judged to be "very suspect". This was reported in the "RSAcases1" worksheet:

An "x" in the Responses string indicates an item excluded from the analysis.
Here we see that the two students, S58 and S96, had 12 exact errors in common (EEIC) and just two response differences (D) over all the items, resulting in an Index, the "Harpp-Hogan statistic", of 6.00 and Sigma of 7.69. These are extreme values for these statistics and the reason their results have been flagged as "very suspect".
The RSAsig1 report looked like this:
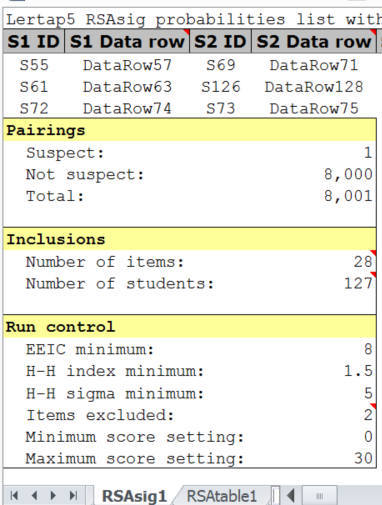
Out of a possible 8,001 pairs of students, only one pair was found to have their item responses flagged as "suspect".
More about the interpretation of RSA output is here.
Results from Wesolowsky's SCheck program are found in the next topic.
