Breakout scores

Contents
Assessing test score differences among groups
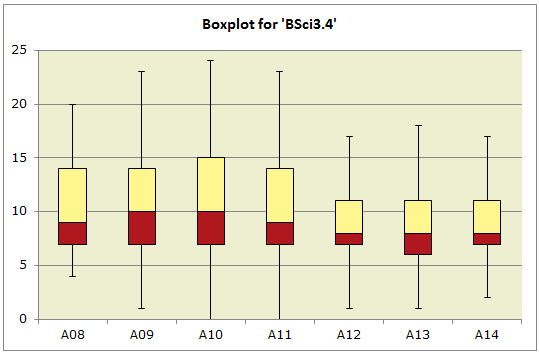
The table and plot for I35 seen in the box above exemplifies Lertap 5's capability for displaying group differences at the item level. A similar capability is available for expressing the extent to which two or more groups differ with regard to a score, such as a total test score. For example, the boxplot to the right indicates how students in seven age levels differed on a rigorously-developed test of science achievement. It shows that the greatest spread of test scores was found in group A10 (ten-year olds), while older students had the lowest median test scores. It appears that the test may have been on the difficult side as the median test score for all groups never exceeded 10 (the maximum possible test score was 25). Lertap 5's "Breakout scores by groups" options are in charge of making boxplots, other graphs, and a corresponding detailed analysis of variance. |
|