Snooping with Excel

Contents
As mentioned, before I jump in and ask Lertap to spin out some results, I always always make an effort to see how the data look. I use readily-available tools to snoop the data, some in Excel, one in Lertap.
The snooping tools in Excel are excellent, excellent. The one I use all the time is the "Filter" option.
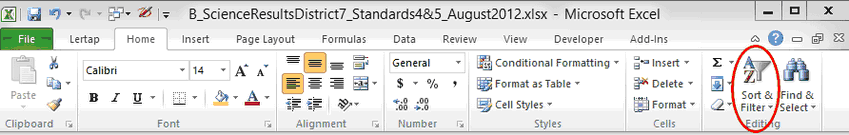
In Excel 2010, Filter is available on Excel's Home tab, in the Editing group, where it's referred to as "Sort & Filter":
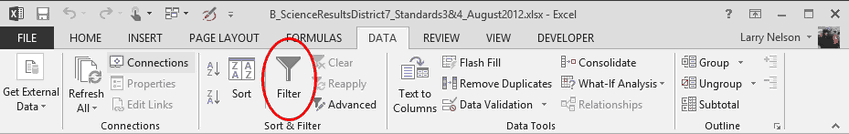
Things are different in Excel 2013, where Filter lives on the Data tab, in the Sort & Filter group:
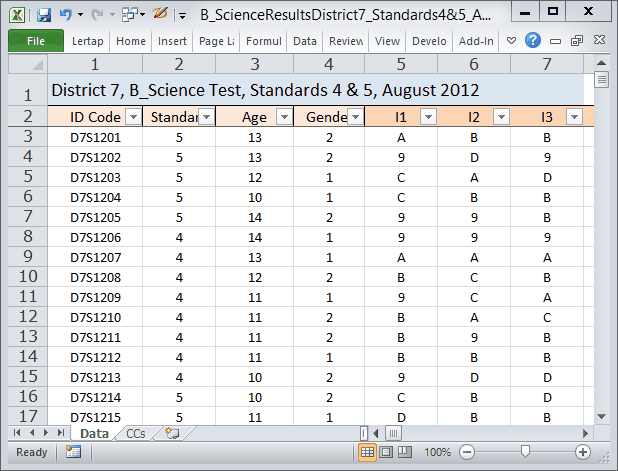
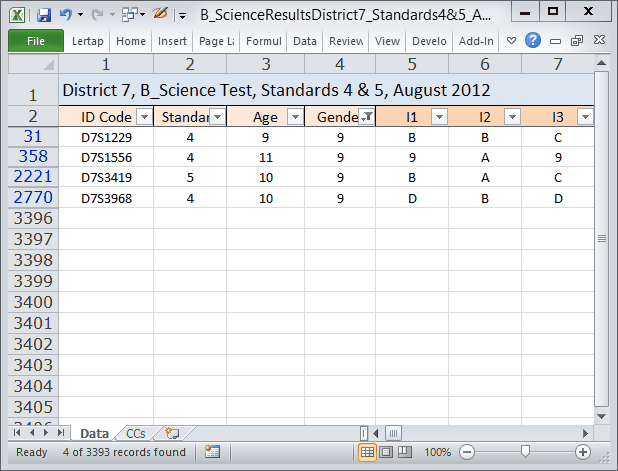
This screen snapshot indicates how column headings change when the Filter option is selected in Excel 2010 -- little arrowheads appear at the top of each column:
Let's say I'm interested in snooping the Gender column. When I click on the Gender column's Filter arrowhead, I get the following drop-down box of options:
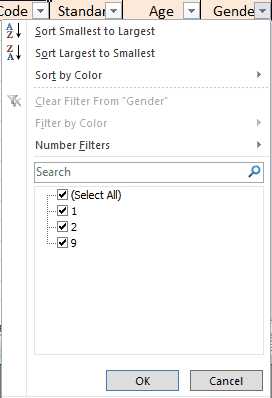
Filter is telling me that the column has 1s and 2s and, what?, 9s? It's not supposed to have 9s, I should have only two codes for Gender, not three. Where are these 9s coming from? I need to snoop.
To find the records with a code of 9 in the Gender column, I click on the (Select All) option to clear all of the Search boxes. Then I click on the box for 9 to indicate that I want to see just those records with a Gender code of 9. This is what I see:
Filter tells me that there are four records with a Gender code of 9, and it indicates the corresponding row numbers in the Data worksheet: rows 31, 358, 2221, and 2770 in this case. If possible I'd get on the phone to the school district to see if they could supply correct gender information for the students with the ID Codes showing, after which I'd make changes in these four records.
Once I've finished snooping Gender, I turn off Filter simply by clicking it again (see the red circles way above).
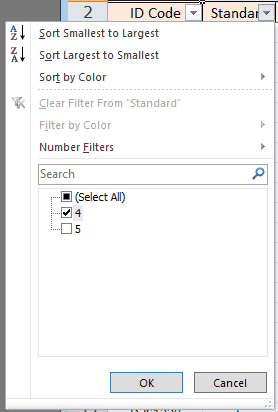
Note something else about Filter: it's possible to drill down. Let's suppose, for example, that I want to find how many Standard 4 students had an age of 13. I begin by clicking on Filter (red circles way above). The little arrowheads are then displayed at the top of the columns. I go to the column with Standard in it, and click on the arrowhead. I select Standard 4 as seen here:
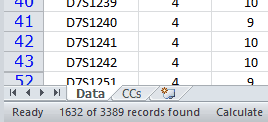
I click the OK button, and Excel filters the Data records, showing only those with Standard = 4. Down on the Status line, Excel tells me that it found 1,632 records having a value of 4 in the Standard column:
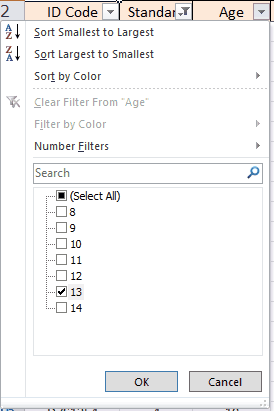
Next I click on the Age column's arrowhead, and select only the 13-year-olds:
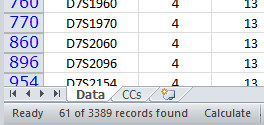
I then look down at the Status line, and find that there are 61 students in Standard 4 with Age = 13:
Excel will make "pivot tables". With a little practice they can also be real handy. Here's one that took about 20 seconds to create in Excel 2010:
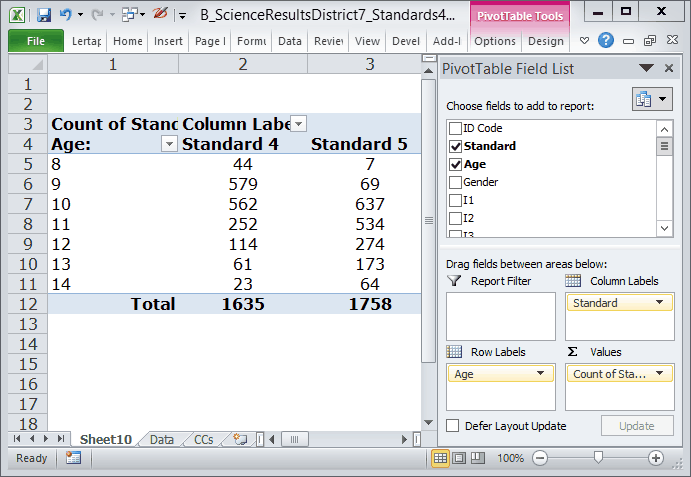
See what I've found out? Most of the 8-year-olds, 44 of them, are in Standard 4. But some of them (rather unexpectedly) are in Standard 5. And I note there are quite a number of older kids in Standard 4. How many are 12 years of age, or older, in Standard 4? 198 (sum 114, 61, and 23). More than 10% of the young students in Standard 4 were not so young. If I go into some of the Standard 4 classrooms, I'll find little kids, and some big ones, too.
Here I might comment that the data in this example are from a country in the "developing world". Not all students began their primary school education at the same age, and, in some cases, students were held back to repeat a school year. Knowing this, I still wonder how we might see seven 8-year-olds in Standard 5 -- perhaps children found to be gifted were allowed to skip grade levels (my wife went to primary school in Myanmar and says that this was called "double promotion"; I went to primary school in Wisconsin and there some of the "most capable" young students could skip a grade providing they had special short summer school sessions with bridging topics).
So, what do I make of this bit of snooping? Well, I've got four bad Gender codes, and also a real age spread in Standard 4 and Standard 5. The four Gender codes of 9 are obviously errors, but I don't have sufficient knowledge of the country to know if the age spreads in the two grade levels are unusual or not. I suspect they're not -- in remote Australian schools, where indigenous children are involved, age spreads like these might be observed.
Erratum: astute readers may have noted a discrepancy. I actually made the pivot table before I did all the snooping using Filter. The pivot table indicates that there are 1,635 students in Standard 4. However, when I used Filter to find records with Standard = 4, it found 1,632. I had taken out the four records with Gender = 9 before I asked Filter to look at the Standard column. Three of these were from Standard 4.
Next topic.