Stats1f and 1b

Contents
The Stats1f report was the only summary of item and test quality made by the initial versions of Lertap. It goes back to the days when an attempt was made to train teachers in the development of multiple-choice tests, and in methods for assessing item and test quality. It used to be that most universities and teacher-training institutes required students to take at least one course in "tests and measurement". I think those days may be gone, but the Stats1f report, made as a tool for teachers to use back then, lives on (in an improved format).
It is certainly possible to gauge test quality by looking at the bottom of the Stats1b report to see test reliability, and the scatterplot of item difficulty by discrimination, followed by a study of quintile plots. I will not say that everyone should look at Stats1f.
But humor me for a moment. Let me Stats1f you.
Here's what Stats1f has to say about one of our star items, I13, found in column 17 of the Data worksheet:
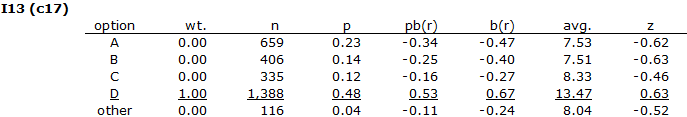
The "wt." column indicates the number of points a student gets for choosing one of the item's options. The table says that those students who select option D will get one point. Option D is the correct answer for I13, and 1,388 students selected it. The "p" column indicates the proportion of students who selected each option; 48% (proportion of 0.48) of our students took option D, the correct answer.
When there is but one right answer to an item, the "p" corresponding to it is the "item difficulty". I13's difficulty was 0.48.
I skip you over to the "avg." column now. It indicates the average "criterion score" for the students selecting each option. The criterion score is what Lertap uses to make its five groups in the quintile plots. It's usually just the test score, but it can be another score, a score often called an "external criterion".
What was the average test score for the 1,388 students who got I13 correct? It was 13.47, you can see it above. The adjacent column, "z" (for z-score), quickly lets me know if this value is above or below the average score on the whole test. Here z = 0.63, meaning that these students, with their "avg." test score of 13.47, did well on the test as a whole.
I digress for a moment, taking you back to the Stats1ul table you loved so much when you saw it in an earlier topic:
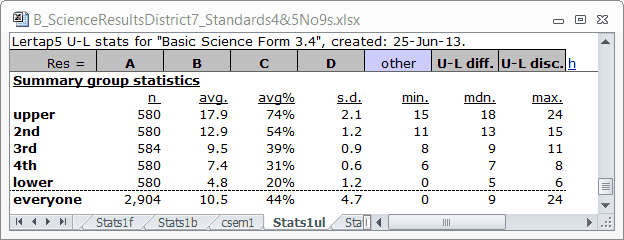
The "avg." score for the second-highest group, "2nd", was 12.9. I can reiterate that the 1,388 kids who got I13 correct, with their "avg." of 13.47, were capable students as their "avg." was above "avg." for the 2nd-highest group.
What was the average test score for "everyone", all 2,904 test takers? Lots of hands go up, thank you very much, and yes, you're all right: it was 10.5. Good going.
Back to I13's table of results above. The "avg." score for the 659 students selecting option A was 7.53; we can assume that most of these were in the "4th" group, next-to-bottom. A similar story holds for the 406 who went for option B, for the 335 who thought C was the correct answer, and even for the 116 students who did not answer I13.
Note that the "z" score corresponding to each of these options is negative. Items which discriminate will have a positive "z" score for the correct answer, and negative "z"s for all the incorrect answers, that is, for the distractors. The more positive the correct answer's "z", and the more negative the distractor "z"s, the better the item discriminates.
An item's discrimination value is "pb(r)" for the correct answer, the point-biserial correlation between the item and the criterion score. What is I13's discrimination? Not so many hands go up now as quite a few of you have left (a common happening when the going gets a bit tough). To the four people who remain, yes, thanks, you're spot-on mates, it's 0.53.
These discrimination creatures can have a minimum of zero (no discrimination), to a maximum of one (really terrific discrimination). A test will discriminate well if the great majority of its items have discrimination values of at least 0.30. The higher the better, of course. (Uh-oh, correction required: pb(r) values may be less than zero, they may go as low as negative one; distractors with negative pb(r) values are, in fact, what we want -- you can see 'em in the pb(r) column above. It's possible for the correct answer's pb(r) to be negative too, but, as you might suspect, that's not wanted at all; it will occur when the "avg." score for the correct answer is below the overall test's average. For an example of this highly unwanted but not really very uncommon event, see this interesting dataset when you have time.)
It can be shown that pb(r) is closely related to the differences among those "z"s; the higher the "z" for the correct answer, and the lower the "z"s for the distractors, the better the discrimination. If you don't care much for pb(r), just look at the "avg." column, and the "z" column. One of the "z"s should be positive; the others negative. One of the "avg." values should be higher than the others, hopefully much higher.
(For more about these things, click here for an internet page, and here for Chapter 7 of the Lertap manual, a great read, praised by numerous readers (not all of them members of my family or students looking for a good grade).)
I take you now to I15's summary in Stats1f:
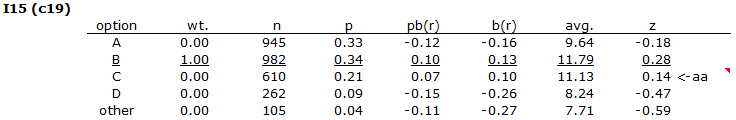
Is this a discriminating item? Is one "avg." much higher than the others? No. Is only one "z" positive and all the rest negative? No.
Is this a discriminating item? No.
Look what's happened. We have above-average students selecting the correct answer, B, which is good.
But look, we also have above-average students selecting one of the distractors, C. This we do not want to happen. The students who go for the distractors, the incorrect answers, should be weak students, below average. Two of I15's distractors worked well enough, but that's not good enough. All of the distractors should have "avg." values lower, hopefully much lower, than the "avg." value corresponding to the correct answer. All of the distractors should have negative "z"s.
We're getting to crunch time now. We have, I suggest, a more precise idea of what's wrong with I15; 610 students with an above-average test score selected option C, a distractor.
Look at I8:
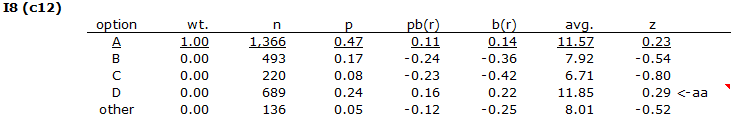
This is worse than I15! The 689 students who selected one of the distractors, D, had better test scores than the 1,366 students who selected the correct answer, A.
Crunch time for the workshop charged with reviewing the test items. Have we scored I8 and I15 correctly? Why are good students selecting bad answers? Are the bad answers not bad?
This is likely. It is ever so possible that the students read something into these two items that the item writers did not see. What the item writers saw as unambiguous, clear-cut items and options, could in fact be murky and ambiguous. We need to discuss this in our workshop: who can see the ambiguity? Often times a staff member can; more often a conversation with the students will uncover the problem. (For more about ambiguity in this context, I suggest searching the internet for "ambiguous multiple-choice questions" -- you should find some sample test items with ambiguities of one sort or another.)
Meanwhile, have the students who selected one of these poorly-functioning distractors been put at a disadvantage? They did not get a point for their answer, but, if there is ambiguity, if the answer they chose has some possibility of being a correct answer, well, they've been robbed of a point. Should we address this issue and give them a point, and say that each of these two questions has two correct answers? Would that not be only fair?
We discuss this in our little workshop. Yes. We decide it would indeed be just to the students to acknowledge potential problems in these two items, ambiguities are there. We'll "double-key" I8 and I15, re-score the test, and tag these items as "do-not-use-again" until we've fixed them.
I show how to double-key test items in the following topic.