Binary items
The term "binary items" refers to test items which have been scored (usually) on a right-wrong basis. Very often a zero is used to indicate the item "score" for a wrong answer, with an item score of 1 (one) used for right answers.
This type of item scoring is also referred to as "dichotomous scoring", and items scored in this manner are often referred to as "dichotomous items".
The analysis of dichotomous test items is a common task undertaken in "IRT", item response theory. The purpose of the BinaryItems macro is to assist IRT users by making it possible to obtain simple quantile plots which reflect how the proportion of items-correct varies by "proficiency" level, where proficiency refers to a measure of ability, or of knowledge.
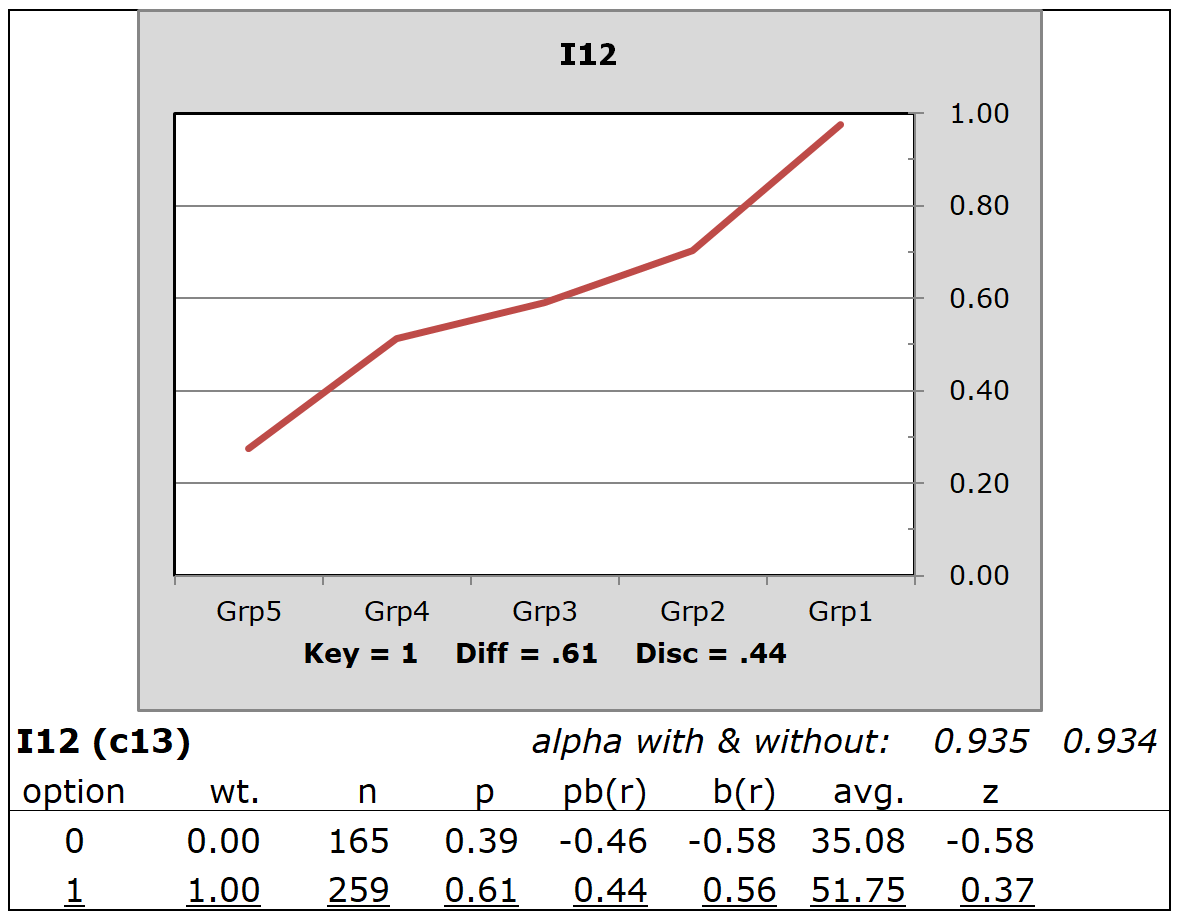
The following quintile plot traces the proportion of correct answers in each of five groups, ranging from "Grp5" to "Grp1", with Grp5 composed of the weakest students, and Grp1 the strongest.

These results for I12 are from the "HalfTime" sample dataset. The five groups were defined, in this case, by using the total test score obtained by 424 postgraduate students of statistics. Total test scores were sorted from low to high, with Lertap getting Excel to pick off the lowest 20% for Grp5, the second-lowest 20% for Grp4, ..., and the highest 20% for Grp1.
The plot indicates a positive relationship between the proportion of correct answers and "proficiency". The stronger the student group, the higher the proportion correct. Here the lowest group had a proportion-correct of just under 0.30 while the strongest students had a proportion-correct of almost 1.00.
In this case, "proficiency" was taken as the total test score. More generally, proficiency may be any sort of score. Lertap's support for "external criterion" scores is used when proficiency has been measured by something other than total test score.
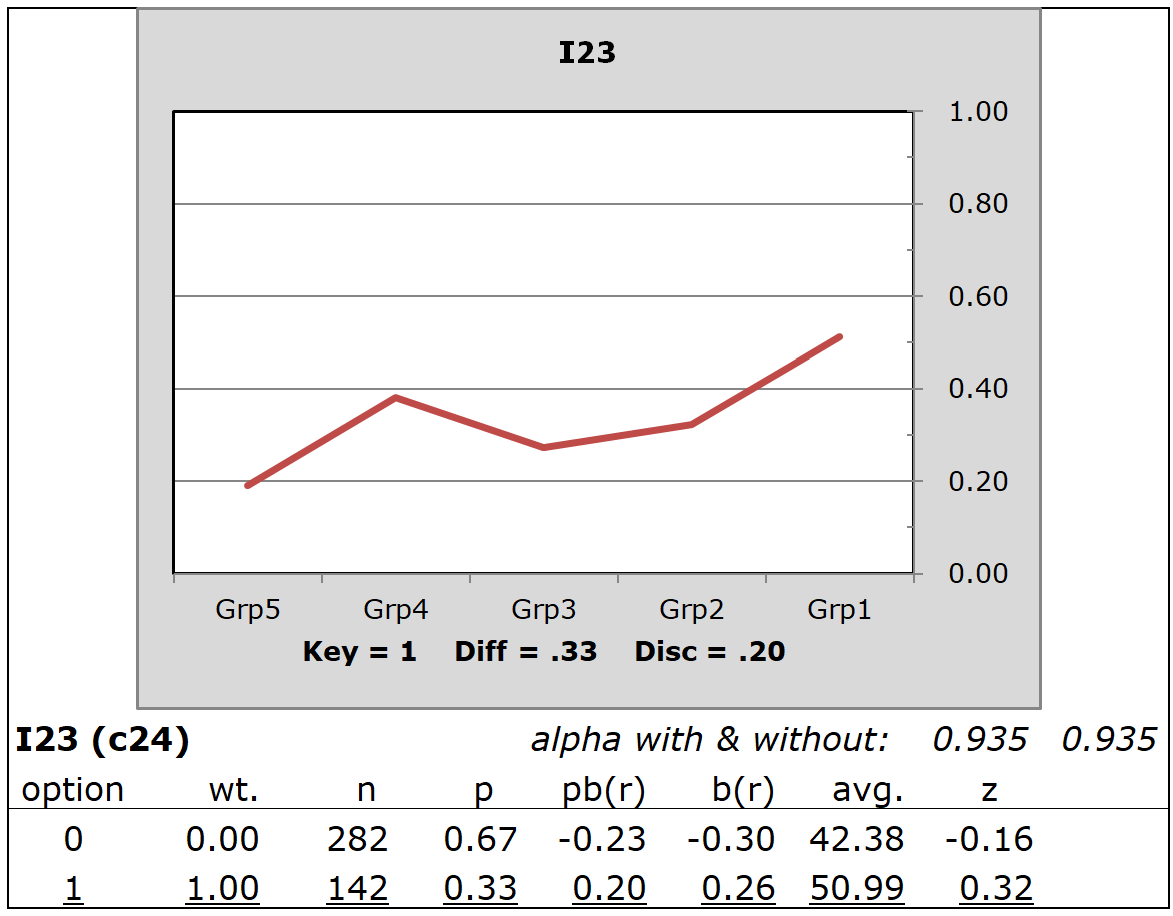
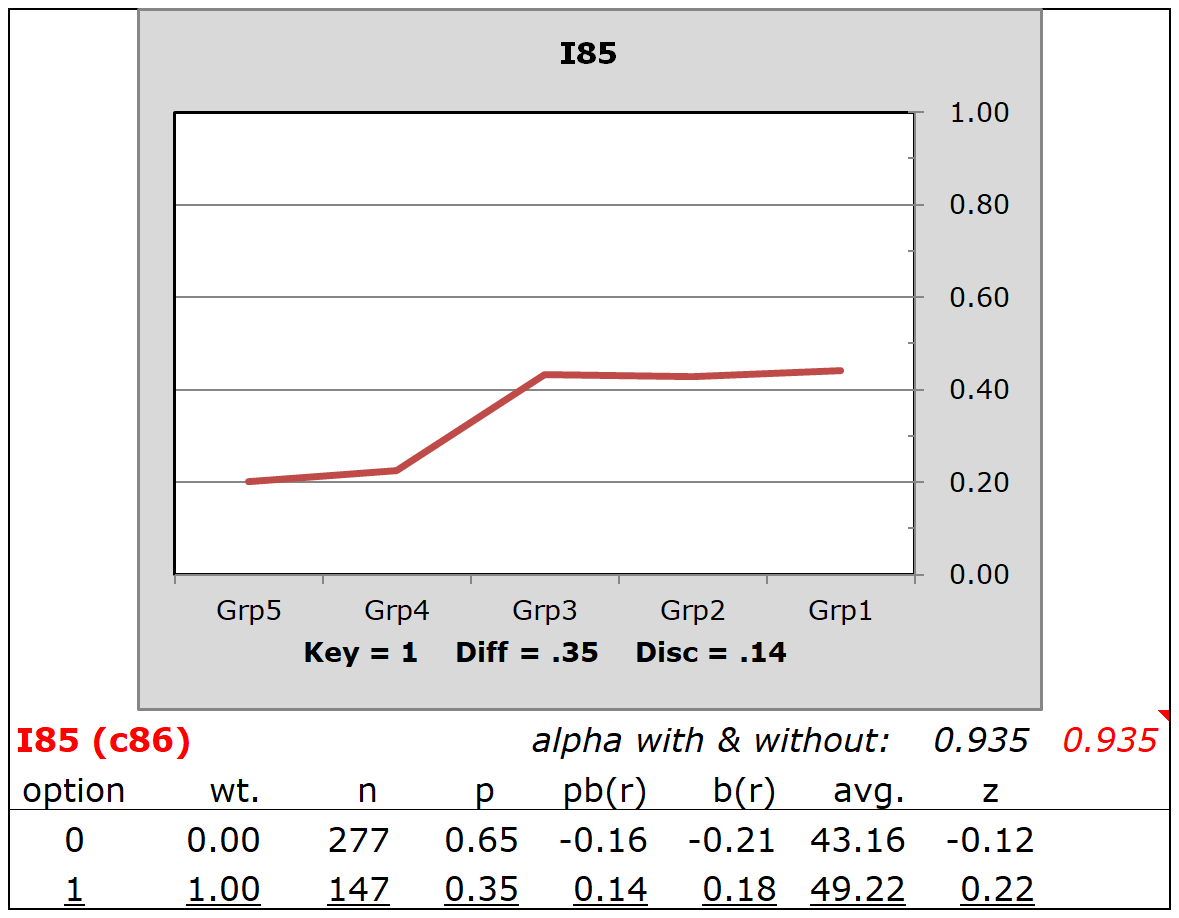
I12's plot displays the response pattern desired for discriminating test items, that is, items capable of identifying weak and strong students. Unfortunately, it is often the case that not all items in a test will display the desired pattern. The two items below have response patterns that are not all that uncommon.

I23 was not a good discriminator. Some of the weaker students (Grp4) had a higher proportion-correct than those in Grp3 and Grp2.

I85 was another item with poor discrimination. In this case Grp3, Grp2, and Grp1 all had about the same proportion correct and, in each case, it was below 50%.
Some readers may wonder if we might expect a relationship between plots such as those seen here and the success of an IRT model to fit the data (or the compatibility of the data with the IRT model)? Yes, definitely. We might expect I12 to "pass IRT muster", but probably not I23, nor I85.
How to use this macro
This macro assumes that you, the user, are looking at a conventional Lertap dataset involving the use of cognitive test items, such as, for example, HalfTime (a simpler example, with a more straightforward CCs worksheet, would be MathsQuiz).
It's assumed that you've applied the Interpret and Elmillon options, and also the "Item scores and correlation" option in order to get an IStats worksheet.
Once these assumptions are met, simply select the macro and let it do its job. It will create a new workbook with a Data worksheet comprised of item scores, and a CCs worksheet ready to use with Interpret and Elmillon.
How to get the response plots
Open the Stats1ul worksheet produced by Elmillon, and then click on "Res. charts" option. This will make the Stats1ulChta worksheet with its series of quantile plots, one for each item. The initial plots will display three response trace lines: one for wrong answers, one for correct answers, and one for "other". Clean these up by using the ChartChanger4 macro to get plots like those above.
When this macro will not be needed
Using this macro, in conjunction with the ChartChanger4 macro, is nothing more than a bonus activity designed to make it easier to see how items are discriminating, and judge how well they might fare when submitted to an IRT analysis.
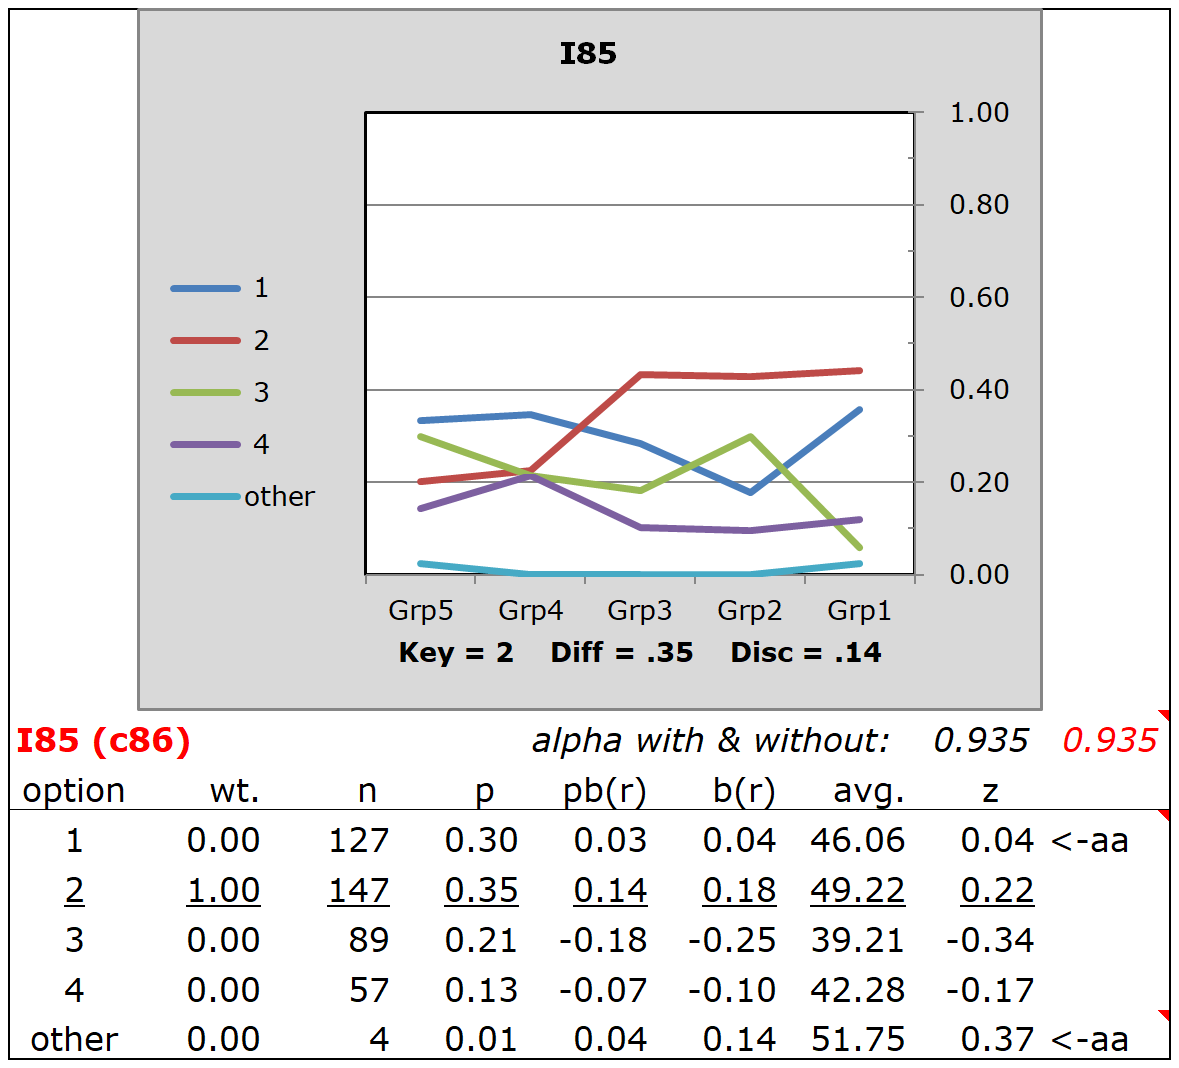
Compare, for example, the above plot for I85 with this one, a conventional quintile plot for I85 which includes trace lines for the distractors:

This plot also shows that I85 is a poor discriminator, but the plot itself might be regarded as a bit "noisy" in comparison. Related comments are found in the ChartChanger4 topic, and its subtopic.
