Chart colours

Contents
It is a fairly straightforward matter to change Excel's standard colour palettes.
If you'd like to change the colours Lertap uses to make its quintile plots, histograms, and group breakout plots, you can. In fact, you can alter Excel's colour palettes so that the changes you make automatically apply to all charts in a workbook. Once you've coloured things in the way you like, you can then pick up the colours used in one workbook, and carry them over to another workbook.
If you don't have a colour printer, you may have had the occasion to frown after trying to print the coloured charts made by Lertap, another Excel application, or a program such as SPSS. Frown not, fair friend: use the procedures introduced here, along with some experimentation, to pick colours which will print well enough, letting you get by until the departmental budget has enough funds to buy a colour printer.
Here's what to do if you're an Excel 2007 or Excel 2010/2013 user:
Click on the Office Button (the File button in Excel 2010 and Excel 2013).
Click on Excel Options, a button found towards the bottom of the screen.
Click on Save.
Look for the section which says 'Preserve visual appearance of the workbook', and then click on Colors.
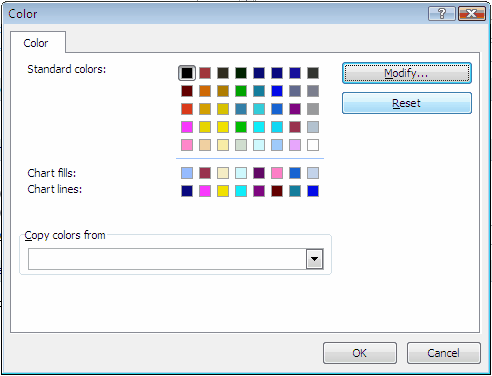
Then, for more information on how to re-map the colours, please refer to this Microsoft document.