Make IbreaksMH charts

Contents
The "Make M-H charts" option on the Run menu is used to get "Lertap 5 DIF plots". It's used once an IbreaksMH1 report/worksheet has been made as discussed in the previous topic.
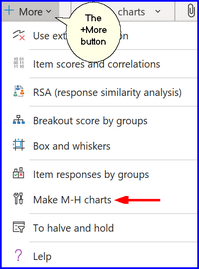
This screen snapshot is what will be seen when the "+More" drop-down option is clicked on:
As this option starts up, it requests users to designate the score range for the DIF plots it be making. This is done using the "Score levels ->" seen in Row 2 of the IbreaksMH1 report. Very often there will be a small number of students at the extremes of the score levels, and the resultant DIF plots will be quite jagged at their edges. Using the score levels on the previous page as an example, one might pick column 7 (score level of 8) to start the plot, possibly ending with column 32 (score level of 33).
Once the score range has been designated, a copy is made of IbreaksMH1 so that users can use it (the copy) if they'd like to apply the option again using a different score range. The copy will be labeled IbreaksMH1(2).
A "DIF plot" for each test item will then be created, similar to the one shown here:
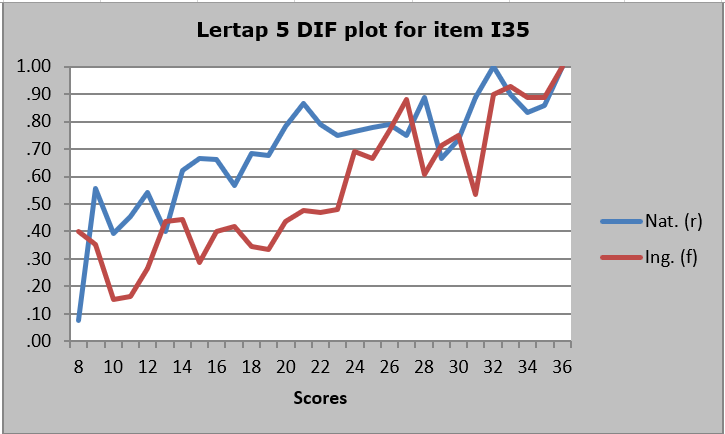
The chart above, for I35, reflects an item that meets the ETS criteria for C (large). There's quite a range of scores where the Nat. group consistently out-performed the Ing. group. This is a picture which may well suggest the presence of 'DIF', differential item functioning.
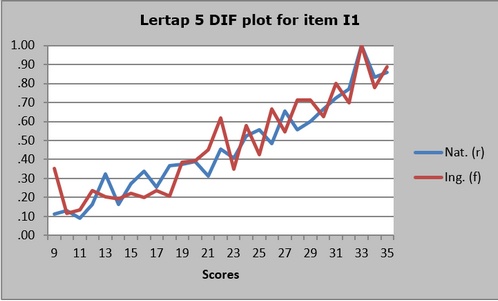
The chart above, for item I1, reflects no DIF, ETS level A (neg.).
The first time the option is used, the IbreaksMH1 worksheet will change - it will have DIF plots, similar to the two above. What was IbreaksMH1, the original worksheet without plots, becomes IbreaksMH1(2). IbreaksMH1(2) will not have plots.
To plot over a new score range, the worksheet without plots, IbreaksMH1(2), would be selected and the option would be called on once again. As before, a range of scores would be entered and a new IbreaksMH1 sheet will result, with plots. The worksheet with the previous previous plots will then be in IbreaksMH1(2), with IbreaksMH1(3) now becoming the original IbreaksMH1 (no plots).
This process may continue; each time the option is taken it should be used with the worksheet that has no plots - this will always be the last of the workbook's IbreaksMH1(x) worksheets, where "x" is the highest number of all the IbreaksMH1() worksheets.
Note that there is a handy way to select all of the "Lertap 5 DIF plots" in a worksheet and carry them over to a Word document. While looking at an IbreaksMH worksheet, hold down the <Ctrl> key on the keyboard and at the same time press the G key. A "Go To" box such as the following should appear:
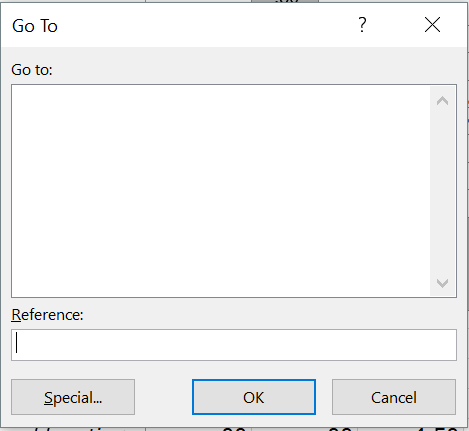
Click on "Special", the button seen at the lower left of the box.
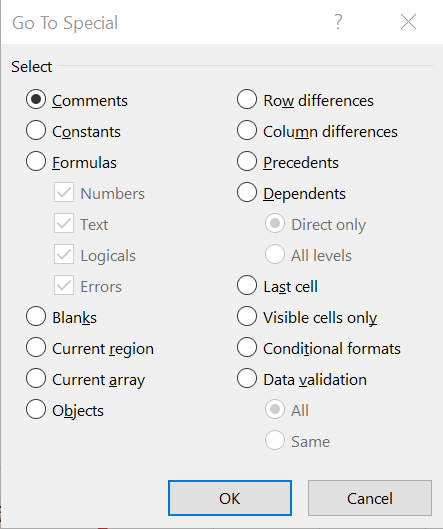
Select the "Objects" circle (also known as a "button"), click OK, and all of the plots (known more generally as 'charts' in Excel) will be copied to the clipboard. They may then be pasted into a Word document. If there are tens of plots, when they are pasted page breaks will be correctly observed so that any single plot will not split over two pages.
Related tidbits:
For other pictures of DIF, see, for example, Figure 4.4 in Camilli & Shepard (1994), and FIGs. 3.1 and 3.3 in Dorans & Holland (1993). (Refer to: http://www.lertap5.com/References.htm.)