Freqs

Contents
“Freqs” means “Frequencies”. When you ask Lertap to “Interpret CCs lines”, it does a bit more—it has a close look at the data columns referenced in *col lines, and makes a tally of response popularities, or "endorsements". Look:
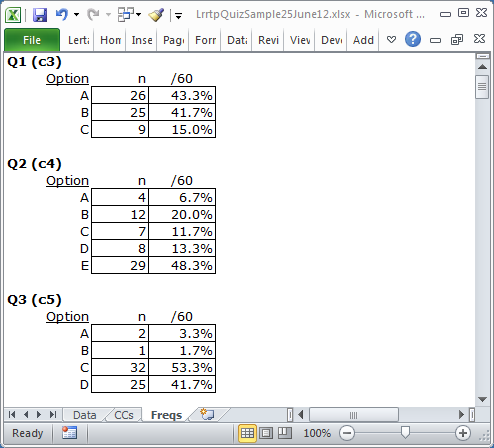
For each item, or question, Freqs reports on the number of times letters or digits were found in the respective item column number in the Data worksheet. For Q1 there were 26 As, 25 Bs, and 9 Cs. The (c3) indicates that Q1 was found in column 3 of the Data worksheet (in this example).
The Freqs column headed “/60” indicates that a total of 60 data records were found, and gives the percentage associated with each frequency. For example, there were 26 As for Q1, which is 43.3% of the total number of 60.
As you scroll through your own Freqs sheets, you may come across some rows which have a ? mark on the left. For example:
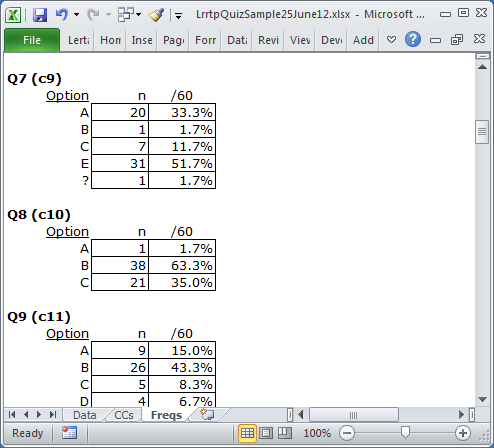
What Freqs is saying is that there was one response on Q7 which was not a letter or a digit. You can find out what it was by going back to the Data sheet, and browsing down the column with Q7 responses (column 9 in this case).
Why doesn’t Freqs show a “D” for Q7? Because nobody chose that option.
While being mindful of Freqs’ feelings, we can point out that it’s a simple, no-nonsense summary of response frequencies. It has no pretenses; it does not claim to be sophisticated.
But it’s useful, to be sure. It quickly summarizes what went on in the data set. And, very importantly, it’s a sure-fire way to see if there are any weird responses in the data columns. For example, if the Q7 tally had included an X, that would be weird as only responses A though F were valid.
What if you do see weird results in Freqs, and want to quickly find the responsible records in the Data worksheet? Excel has a set of Data options, one of them is "Filter". This is a powerful little option which will let you rapidly find records which have “weird” results. (Keep in mind that Excel’s on-line Help is there to assist you, should you have questions on how to use the Filter option.)
Here's a screen snapshot of the Filter option as seen when using Excel 2010:
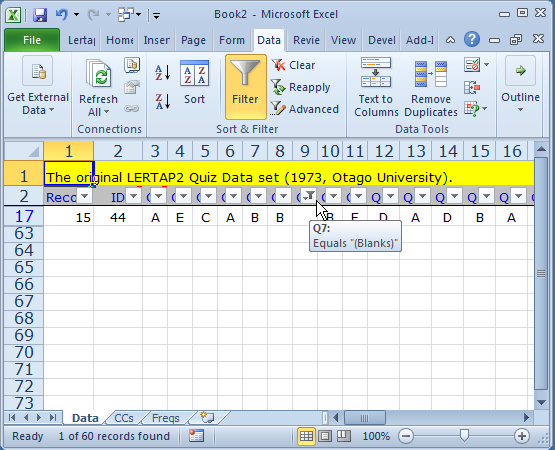
A practical example of Excel's filter in action may be seen at the bottom of this topic.
Freqs is a worksheet produced by Lertap's "Interpret" option. It's regarded as a crucial report, one which ought to be consulted before Lertap's other reports are examined -- data processing errors are not at all uncommon, and Freqs is, in Lertap, the best way to quickly spot them.
Note: for a practical example of using Freqs and looking for possible data processing errors, you might treat yourself to a read of this topic.