System settings

Contents
Lertap's main options are set in the System worksheet of the Lertap5.xlsm workbook. The screen snapshot below displays some of the settings as seen in mid 2019.
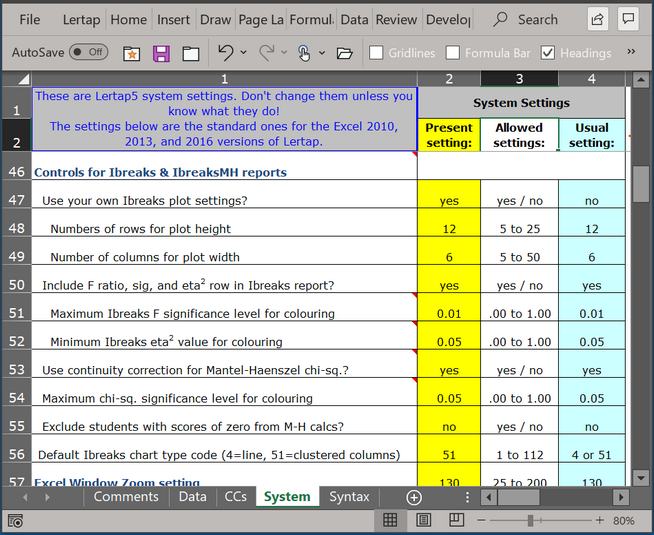
The options which pertain to Ibreaks and IbreaksMH reports are seen in rows 47 to 56.
Ibreaks attempts to determine the optimal size for its charts. However, you can set your own by using the settings in rows 47, 48, and 49.
Rows 51 and 52 determine when Excel will use colours to highlight the sig and eta2 values in Ibreaks charts. Row 54 does likewise for the MH Chi sq prob cell in an IbreaksMH table.
Row 53 turns Yates' chi -square continuity correction on or off. In this snapshot it's set to No, which means Off.
Row 55's option is presently ineffective; Lertap doesn't use it. If scores of zero are encountered, they're converted to a score of one automatically. If this is done, Lertap will display an informative message.
Row 56's setting controls the type of chart that will be used as the default when Lertap5 produces Ibreaks summaries. Each Excel chart type has a corresponding numeric code. A list of the codes was available at this website in August 2019.
Printing
The January 2015 release of version 5.10.5 was the first to introduce System settings which provide for some control over page margins and the page breaks inserted whenever Excel's print options are used.
More about this is found towards the end of the pdf file available here (see the heading "Ibreaks charts have not been left out" on page 14).