MDO for cognitive tests (Statsb)

Contents
The previous topic discussed how the MDO and did-not-see options affect the information reported in Statsf reports.
Now you're set to see the corresponding Statsb reports:
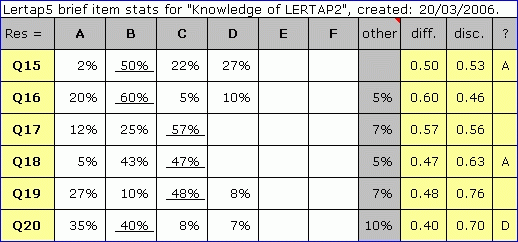
The first report has an "other" column which indicates the number of people with missing data on each item, expressed as a percentage figure. The statistics in the diff. and disc. columns are based on calculations which include the people with missing data.
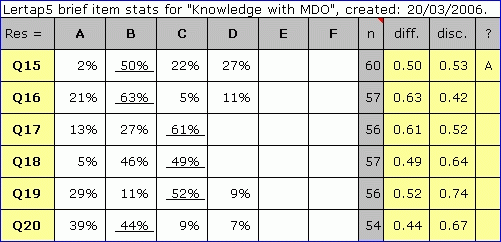
In the second report, the "other" column has been replaced by the "n" column. The entries in this column indicate how many people answered each item, and the various percentage figures, plus the diff. and disc. values, are based on n, that is, they exclude missing data. Lertap uses what is termed a "pairwise" exclusion rule to calculate the diff. and disc. values: if a student is missing data for the item, or did not see it, s/he is excluded from the calcs. for that item.
The report above corresponds to the Test Pilot results mentioned in the previous topic. The numbers seen in the "n" column exclude the number of cases with missing data (if any), as well as the number of cases who did not see the item (if any). To see how many cases were missing data, or did not see the item, refer to the Statsf report which corresponds, or to the Freqs report.
Related tidbit:
A reminder from Chapter 10 of the manual: the Statsb reports are computed on an item level. The disc value they display is a conventional product-moment correlation between the item and the criterion, corrected for part-whole inflation.