Omega Factors Example

Contents
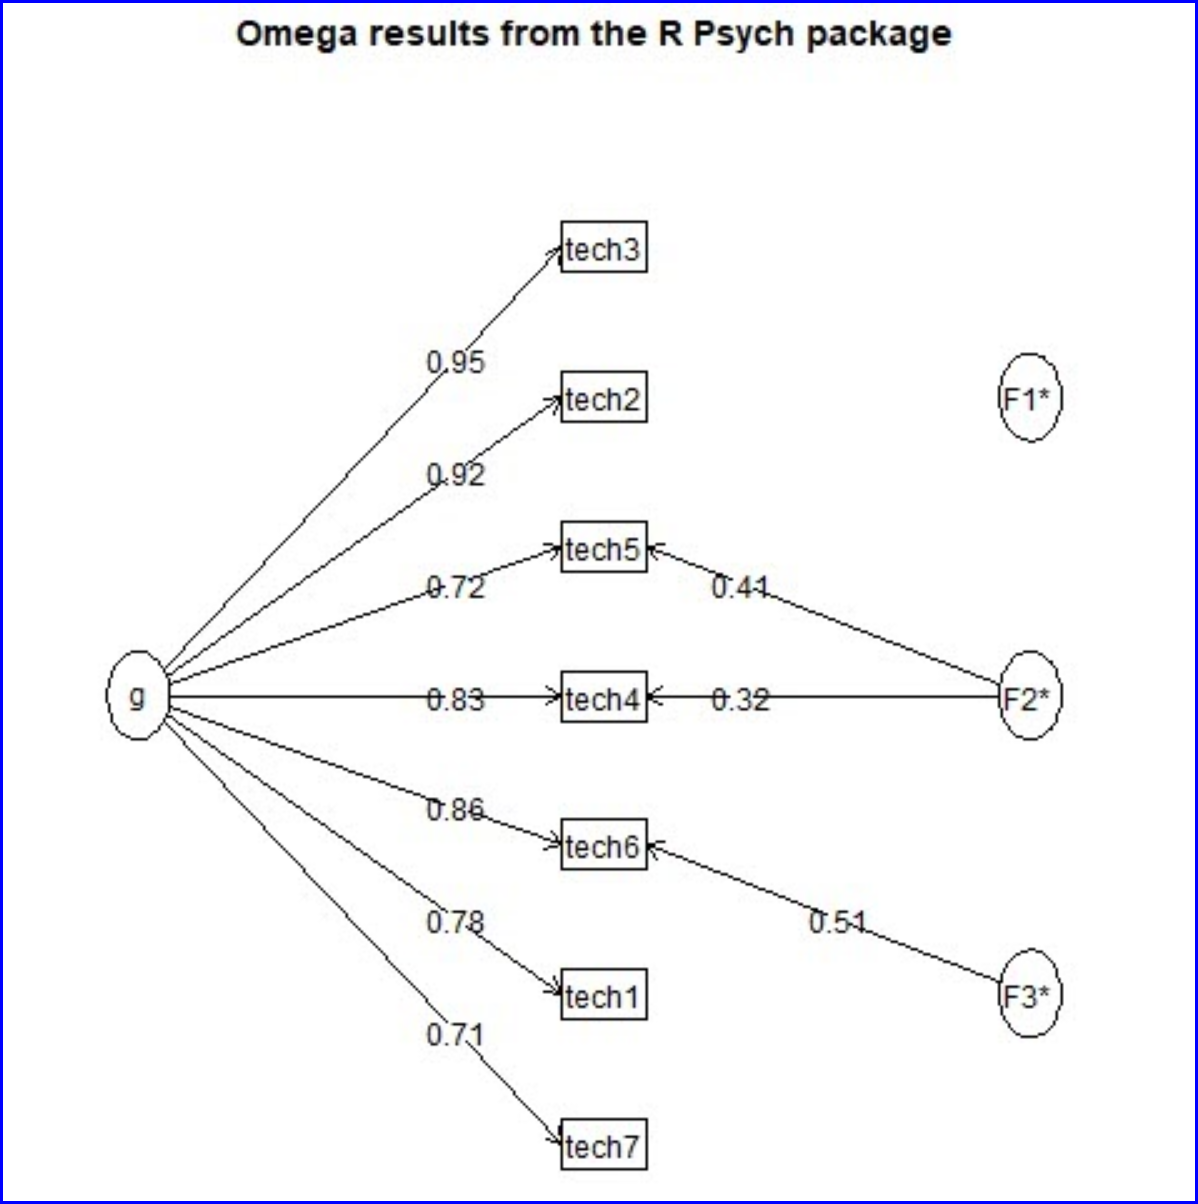
A sample of the factor structure graphs produced by the omega function in the Psych package is shown below for the SES dataset:
The omega routine's text output corresponding to the graph above is shown here:
[1] "Wed Nov 29 13:37:11 2017"
Omega results from the R Psych package
Call: omega(m = DunnItems, digits = 3, title = "Omega results from the R Psych package")
Alpha: 0.94
G.6: 0.94
Omega Hierarchical: 0.93
Omega H asymptotic: 0.97
Omega Total 0.95
Schmid Leiman Factor loadings greater than 0.2
g F1* F2* F3* h2 u2 p2
tech1 0.78 0.62 0.38 0.99
tech2 0.92 0.85 0.15 1.00
tech3 0.95 0.91 0.09 1.00
tech4 0.83 0.32 0.79 0.21 0.86
tech5 0.72 0.41 0.69 0.31 0.75
tech6 0.86 0.51 1.00 0.00 0.74
tech7 0.71 0.51 0.49 0.99
With eigenvalues of:
g F1* F2* F3*
4.80 0.01 0.27 0.28
general/max 17.42 max/min = 47.89
mean percent general = 0.9 with sd = 0.12 and cv of 0.13
Explained Common Variance of the general factor = 0.9
The degrees of freedom are 3 and the fit is 0
The number of observations was 193 with Chi Square = 0.29 with prob < 0.96
The root mean square of the residuals is 0
The df corrected root mean square of the residuals is 0.01
RMSEA index = 0 and the 10 % confidence intervals are 0 0
BIC = -15.49
Compare this with the adequacy of just a general factor and no group factors
The degrees of freedom for just the general factor are 14 and the fit is 0.15
The number of observations was 193 with Chi Square = 27.61 with prob < 0.016
The root mean square of the residuals is 0.03
The df corrected root mean square of the residuals is 0.04
RMSEA index = 0.073 and the 10 % confidence intervals are 0.03 0.11
BIC = -46.06
Measures of factor score adequacy
g F1* F2* F3*
Correlation of scores with factors 0.98 0.09 0.67 0.93
Multiple R square of scores with factors 0.96 0.01 0.46 0.87
Minimum correlation of factor score estimates 0.91 -0.98 -0.09 0.74
Total, General and Subset omega for each subset
g F1* F2* F3*
Omega total for total scores and subscales 0.95 0.94 0.85 0.87
Omega general for total scores and subscales 0.93 0.93 0.69 0.82
Omega group for total scores and subscales 0.02 0.00 0.15 0.05