Stats1b plots (cognitive items)

Contents
A plot of item difficulty by discrimination is given at the bottom of every Statsb report for cognitive tests. (There's a different plot in the case of affective items, such as those from surveys.)
The screen shots found here were taken from the Excel 2010 /2013 version of Lertap 5. In this case a 56-item cognitive test had been processed.
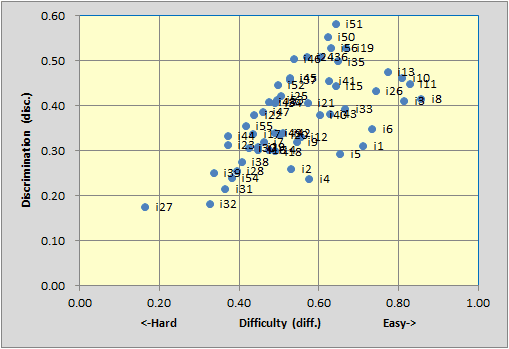
These plots of item difficulty by discrimination are made using the "diff." and "disc." figures displayed in a Statsb report. As these things go (Joe), this plot suggests a test with high reliability -- almost all of the items have discrimination figures above 0.20, with many going over 0.30. Coefficient alpha for this administration of the 56 items was 0.91.
The item labels in the case above were i's followed by an item number, i1 through i56; Lertap uses whatever labels are found in the first column of the Statsb report -- when these labels are longer than four characters, Lertap will use only the last four. For example, if an item label is Ques107, the plot will show s107.
Displaying labels will often make the plot crowded, and a bit hard to read. Fortunately, the labels may be easily hidden. To do so, use the "labels toggle" option. This is what the plot looks like after the option has been used to hide the labels:
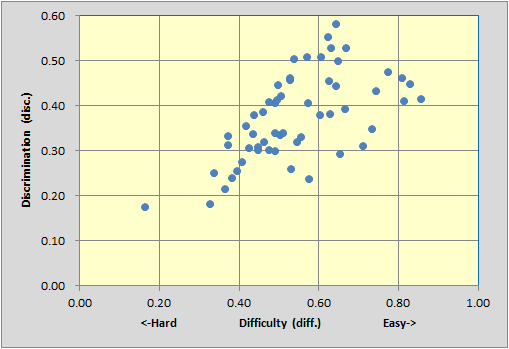
These plots are simply Excel charts; you can reformat them in many ways -- right-click or double left-click at various spots, and options will appear.