Visual item analysis

Contents
Visual item analysis with quintile plots
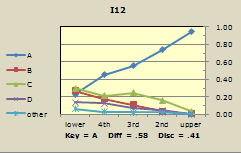
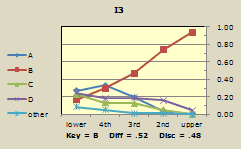
The matter of assessing the quality of cognitive test items has traditionally been based on tables of numeric data, embroidered with core global measures, such as estimates of test reliability. Lertap's quintile plots provide an alternative method: pictures. Have a look at some examples, and see if you too might not be found wearing smiles for quintiles. Click here to have an initial look. See "packed plots" in action here. See fancy new capabilities introduced in January 2015. Then, pour yerself another cuppa something, sit back, and take in a short practical example from some quality achievement tests developed and used in Central Java ('Jateng'). Make a leap for Lelp (Lertap help) to see even more about quintiles and associated Lertap 5 options. |
|