Reliability vs. 9s

Contents
My fourth question:
4. How are the 9s affecting test reliability?
Back a ways, I found a reliability (coefficient alpha) of .841 for this administration of the 24-item test.
Know what I'm going to do now? Knock out all those students with a 9s score of 12 or more from the dataset. I want to have a Data worksheet wherein all of the students answered at least half of the items.
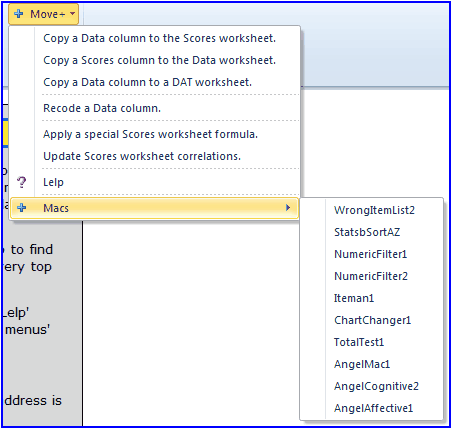
How will I do it? I'll use the "Numeric Filter 1" macro, available from the Macs menu:
After this macro has run, I'm left with a Data worksheet with 2,904 students.
Next, I take Lertap's Interpret and Elmillon options, as per usual. I look at the bottom of the Stats1b report, get out my screen snapshotter, take a picture, and present results here:
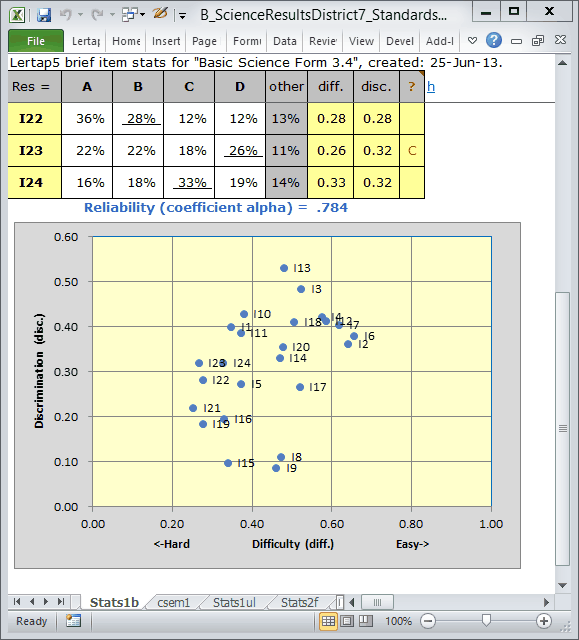
Reliability, as indexed by coefficient alpha, has gone down. It was .841 with all of the students; now, after taking out the 485 students who left twelve or more items unanswered, it's .784. This is quite a drop.
In taking out those students, I have removed a block of students whose item responses were pretty consistent: they all tended to "answer" 9. Coefficient alpha, an internal consistency statistic, has taken a hit, it's gone down without this block of consistent responses.
There are some other observations I could make. The items are somewhat easier now that the 9-ers have been removed. Compare the scatterplot above with that seen before the 9-ers were removed: the "blips" have shifted to the right, there are now fewer items with difficulty values below 0.40.
The average test score has gone up. Now, without the 9-ers, it is 10.48. It was 9.31 before.
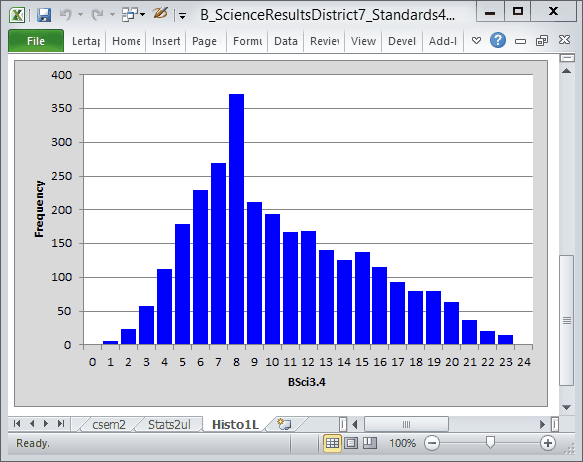
One more thing. Got time to see a histogram of the test scores?
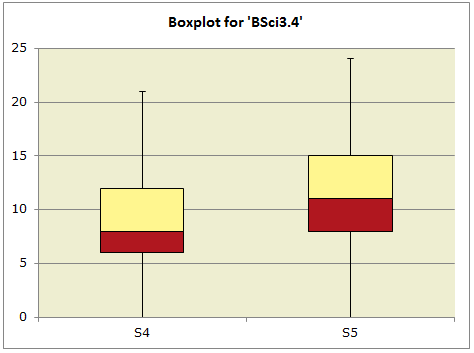
Got time for one more one more thing? Good -- let's now compare results from the two grade levels, using that whiz-bang "Breakout score by groups" option, getting a Boxplot and a couple of score histograms, one for each grade, or "Standard".
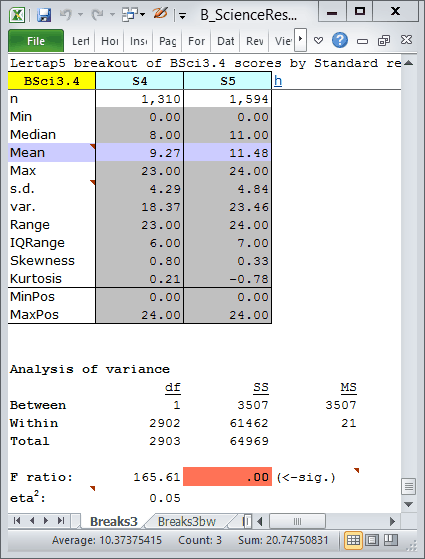
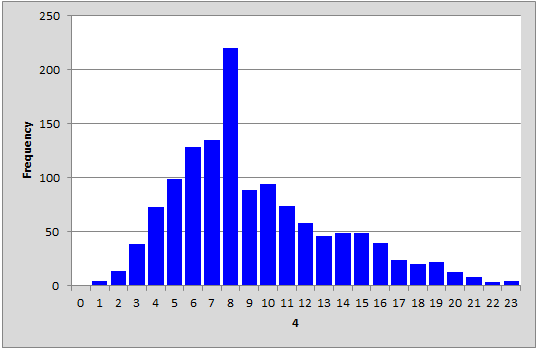
The score histogram for Standard 4:
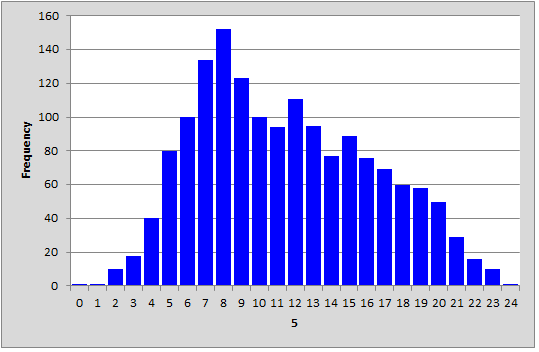
The score histogram for Standard 5:
The Boxplot and the two histograms were made using the Breaks3 report (usually I have a Breaks1 report, but, in the background, I had been messing around with some other breaks before I came to this spot in the story; each time the "Breakout score by groups" option is taken, it looks to see if there are already some Breaks reports, and, if so, it finds the number of the last one, such as Breaks1, and increases the report number by one, making Breaks2, or Breaks3, or ...).
Read more about Boxplots here, and how to make histograms from a Breaks report here.
Back to my question for this topic: how did the 9s affect reliability? They inflated it. With the 9s in the picture, reliability (coefficient alpha) was .841. It went down to .784 once I had extracted the 9s.
I extended this topic by looking at grade-level differences in the test score. The higher grade, Standard 5, had better test scores; the test was harder for the Standard 4 students. Almost as an aside, I also looked for item-level differences between the grade levels. Results are in the next topic.