Part 2: missingness

Contents
I have had an initial go with the Data worksheet, checking on data quality, snooping here, snooping there. I found four records with bad Gender codes, and I eliminated them from Data when you weren’t paying attention. I had reason to suspect that a fair number of the children did not answer a fair number of them test items, so I used Excel's COUNTIF function to add an extra column to the Data worksheet which indicated the number of items not answered by a student. I also demonstrated how Lertap may be used to count the number of 9s.
Continue? Ready to roll? Okay.
Note that I am still not running in production mode. I much prefer to step through Lertap options as I need them, one by one, pausing after each step to ponder what Lertap and Excel reveal.
I have the Data and CCs worksheets as shown earlier (the new 9s column in the Data worksheet doesn't show in my screen snapshots, but it's there, in column 29, also known by Excel as column AC).
I click on Interpret and end up with Freqs:
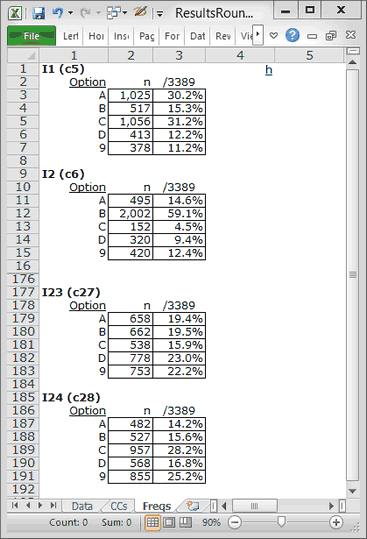
I have hidden many of the rows in Freqs so that you can see a couple of things. Note, first of all, if you would, that there were lots of 9s for the items. Remember what the 9s mean? Unanswered questions. On I1, 378 kids did not answer. By the time I get to the last two items, I23 and I24, more than 20% of the students did not answer. Hmmmm ....
I click on Elmillon and end up with Scores, Stats1f, Stats1b, csem1, and Stats1ul. Look at the little scatterplot at the bottom of Stats1b:
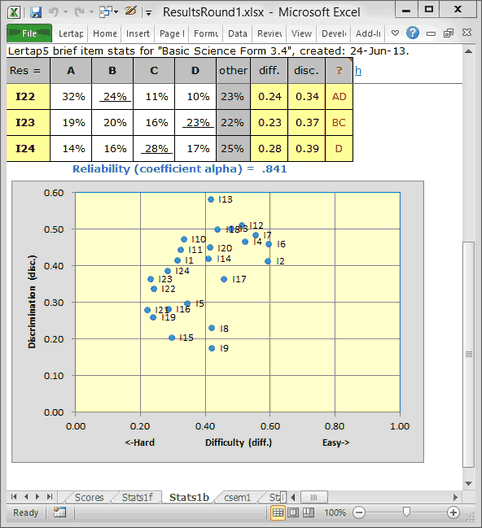
You must not look at the reliability figure of .841. Well, alright, look at it. For a test with a relatively small number of items (24), this woud be regarded as a reasonable result. I might ordinarily agree, but there may be more going on here -- I'm not going to be happy until I know more about all those unanswered questions.
You can see that the items tended to be on the difficult side: the scatterplot has many blips to the left of the diff. 0.40 line. These are the items where fewer than 40% of the children were able to pick out the right answer.
A problem is that diff., the item difficulty index, may have been lowered by the large number of students who did not answer the items. This could also impact on the reliability estimate: coefficient alpha is an internal consistency index; the more a student consistently gets items correct, or consistently gets them incorrect, the better alpha might be. And, Lertap generally interprets unanswered questions as "incorrect". (But not always. See this discussion on did-not-see items and Lertap.)
The time has come to look into the extent of unansweredness in this dataset. Please topic forward.