Snooping with Freqs

Contents
I've already mentioned that Lertap's Freqs report is a useful tool for checking on data quality. In some cases it's not as "snooper" as Excel, but it can still be quite useful.
Let me show you. I modified the original CCs worksheet by inserting two lines above the original first row. Look:
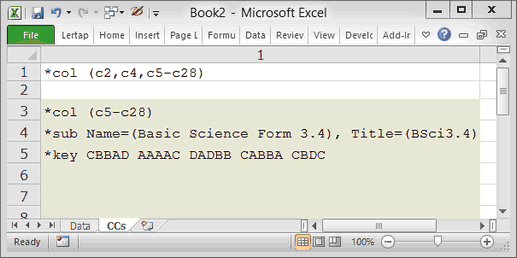
Now my *col line mentions two other columns. Column 2, or "c2", contains the code for Standard, while column 4, "c4", has data for Gender.
The second line is completely blank. Whenever Lertap encounters a row in a CCs or a Data worksheet whose first column is empty, or "blank", it'll think that it has reached the end of the world, and will then proceed to process results. This is what I do when all I want from Lertap is its Freqs report. I have the *col line, followed by an empty line, or row. After the empty row I can have other rows with stuff in them; Lertap will not read these rows, but I don't want it to. (This is handy with the Data worksheet too: when I want to see if my CCs lines are going to do all that I want, I'll test them out with just the first 50 data records by inserting a blank row after the 52nd row in the Data sheet -- remember, the first two rows in the Data worksheet are reserved for other information; student responses begin in row 3.)
If I now click on Lertap's Interpret option, the resultant Freqs report will include information for columns 2 and 4. Behold:
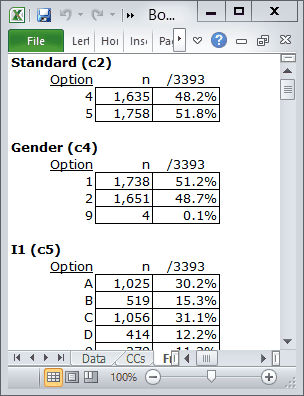
Ah-ha! The values for Standard are as expected, just 4 and 5, but the Gender column has four 9s, which were not expected.
Okay then, thank you Freqs, you've pointed out that of the 3,393 data records, four of them have a missing Gender code. What next? Well, it depends -- if it's not too much trouble to get the missing data from the school district, I'd give it a try. Otherwise, I'd make a copy of the workbook, delete the four records from its Data worksheet, and carry on.
You do know that making a copy of a Lertap workbook is exceptionally easy, don't you? Just click on the Copy icon:
Why didn't I include the third column, "c3", in my special-purpose *col row discussed above? Because I know what will happen: Lertap will toot its horn and announce that its Interpret option does not like to process Data columns if they have more than one character. The third column, c3, has Age in years, and, unless all students are less than 10 years old, there will be entries in this column with two "characters", such as 10, 11, 12, and 13. The Interpret option will, cough, sputter, and say sorry, no can do column 3.
So, okay, I've shown that Freqs can be used in a manner analogous to Excel's Filter option when it comes to Data columns with single-character fields. This is handy, but note that Excel's Filter can actually show me which Data records have strange codes -- Freqs cannot.
When it comes to Data columns with more than one character in them, Freqs fails. Filter does not. But Lertap does have another tool which would, for example, let me look at the distribution of age by Standard -- it's the "Breakout score by groups" option. When combined with the Histograms option, and the "Box and whiskers" option, I can get very enlightening graphs. Later on I'll show you how to use these tools; for the moment let me just say that what I'd have to do is first copy the Age column from the Data worksheet to the Scores worksheet, after which it's pretty clear sailing. (There are options on the Move+ menu which let me move columns back and forth between Data and Scores.)
Next.