z-score

Contents
z-scores are found in numerous Lertap reports.
What are they? Basically, they're standard measures of how far any given score is from the average score.
They're handy. Very handy in many cases.
As an initial example, consider the scores from a 60-item exam given to students in an international Master of Nursing program (see the "M.Nursing" dataset). The Scores worksheet looked like this:
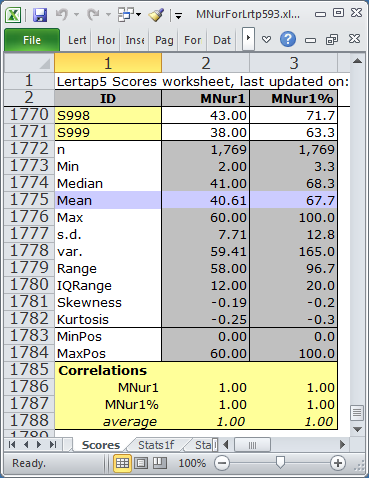
There were 1,769 students. Lertap made two scores for each: MNur1, a "raw score" (number of items correct, in this case), and, MNur1%, the raw score expressed as a percentage of the maximum possible score ("MaxPos").
The average MNur1 score, the mean of all 1,769 MNur1 scores, was 40.61, with an s.d., standard deviation, of 7.71.
Okay. Say you were told that a student named Gisela got 35 of the 60 items correct. Her MNur1 score would be 35.00, with MNur1% at 58.3%.
Can you interpret this score? Was it a good one? At first glace it sort of seems good, doesn't it? She got more than half of the items right. But what if this were an easy test, with almost everyone getting at least 50% of the items correct? What then?
Well, we might compare it to the average score of 40.61. Gisela's score was obviously below the mean. We might thus say that her score was "below average".
Somebody might then ask if it was well below average, or what? We might attempt to answer this by calculating a "deviation score" for her by finding the difference between her score and the average. It would be 35.00-40.61, or -5.61.
But we still would not know if this was "well below average" or not.
At this point someone else, fresh from a tests and measurement class perhaps, might say that we could "standardize" the deviation score by dividing it by the standard deviation. Okay, fair enough. For Gisela, we would have -5.61/7.71, or -0.73. This is called a "standard score", or a "z-score". If we converted all 1,769 scores to z-scores, their mean would be zero and their standard deviation would be one. This is always the case. As long as the standard deviation of the original scores is greater than zero, converting all original scores to z-scores will result in new scores with a mean of zero and standard deviation of one. Always. Take any set of original scores, convert them to z-scores, and out will come a set of new scores with a mean of zero, and an s.d. of one.
But the question still remains: was Gesila's z-score of -0.73 "well below average, or what?".
A very common way of addressing this question is to start by saying that we'll assume the test scores have a distribution similar to that of the "normal curve". This is not at all an unusual thing to do. Not at all. It turns out that quite a number of measures of human mental abilities result in scores with normal or near-normal distributions.
In a normal distribution, a z-score of 0.00 corresponds to the 50th percentile: half of the scores will be above this figure; half will be below.
In a normal distribution, a z-score of -1.00 corresponds to the 16th percentile; 16% of all students will have z-scores below -1.00, 84% will have z-scores above it.
So now, at last, we can say a bit more about Gisela's score. If the scores follow that of a normal distribution, she's (unfortunately) in the lower group of the class on this test. But at least she's above the 16th percentile. How far above, exactly? Well, if we got out a table of z-scores for the normal curve (given in many textbooks), we'd see that she's at the 23rd percentile, assuming a normal distribution of scores.
Here's a picture of standard scores, z-scores, when they follow a normal distribution:
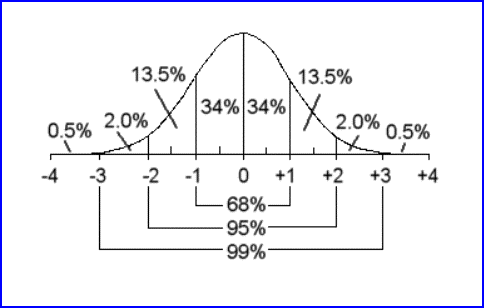
Under the normal distribution, 68% of all z-scores are found in the -1.00 to +1.00 range; 95% are in the -2.00 to +2.00 range; 99% in the -3.00 to +3.00 range.
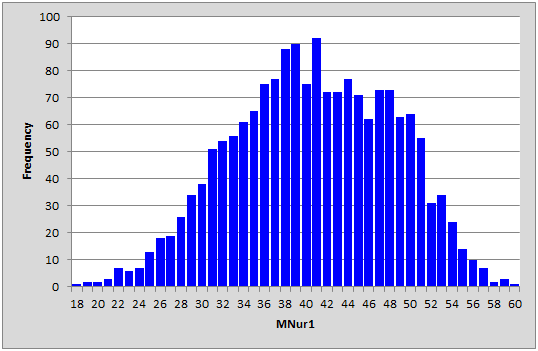
Now, out of interest, look at the histogram Lertap made for the MNur1 score:
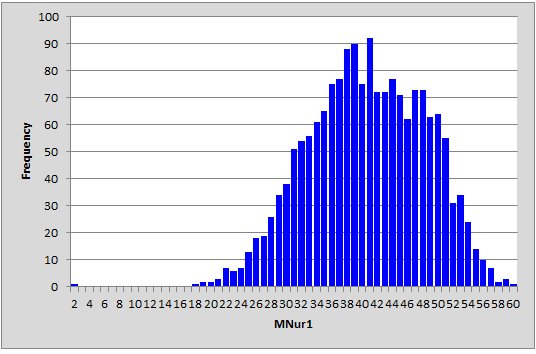
There's something odd about this graph. Can you spot it? There's a blip in the lower lift. Someone had a score of 2.00?
Yes indeed. Look at this:
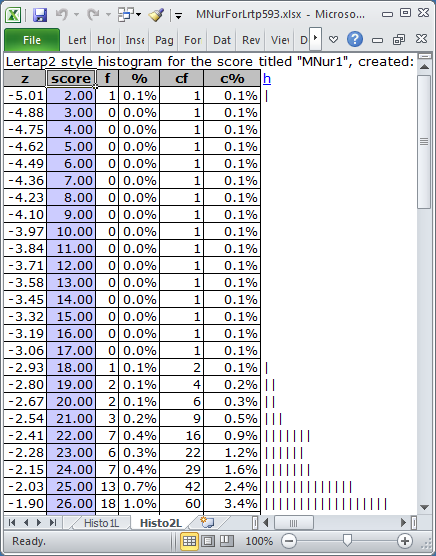
Look at the z-score of -5.01 for the score of 2.00. Very very odd. Not expected, especially when the next lowest score was 18.00, with corresponding z-score of -2.93. The score of 2.00 was an "outlier", a weird result to be sure.
It turns out that the student with the score of 2.00 failed to answer most of the questions. Perhaps some sort of emergency arose, and the student was excused from the test venue, leaving her/his answer sheet behind.
Outliers such as this should be deleted from the Data worksheet, and Lertap's Interpret and Elmillon options used anew to get results. This is how the histogram looked after the faulty record was removed from the Data sheet:
The z-scores corresponding to the lowest and highest test scores were -2.96 and +2.53, respectively.
z-scores also play a prominent role in Lertap's Statsf reports. Look at the example below:
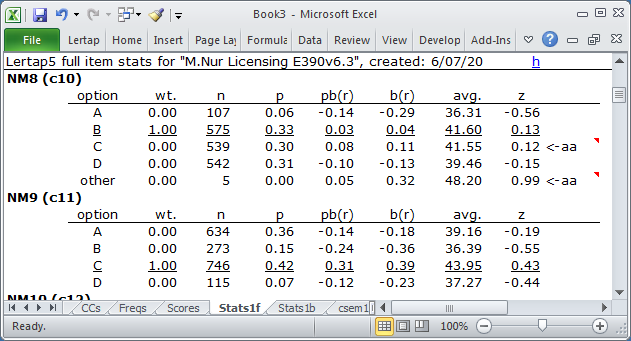
The second item showing above, "NM9" (found in column 11, c11, of the Data worksheet), has no flags. The 746 students who selected the correct option, C, had an average z-score of 0.43, comfortably above the mean of the criterion score. The z-scores on all the distractors were negative. This is what we desire when our objective is to have items which discriminate, allowing us to distinguish the strongest and weakest students.
The profile for NM8 is not as good. The 5 students who did not answer the question had a very high z-score; the "aa" flag is drawing our attention to this. The students who took option C, a distractor, were also above average, and Lertap waved another "aa" flag to let us know. In fact, their z-score was almost equal to that of the 575 students who selected the keyed-correct option, B.
Love z-scores? They're of real assistance when we try to interpret scores, and item performance.