EC quintile plots

Contents
Special note: the charts displayed in this topic were produced by the Excel 2003 version of Lertap, now very dated.
It is possible to make both quintile-a and quintile-b plots with an external criterion score. When the Run menu's External criterion analysis option is selected, an upper-lower (groups) worksheet is created, assuming the subtest involved is a cognitive one, and the option to create upper-lower analyses has been set to Yes in the System worksheet.
When an external criterion is used, the upper-lower (groups) worksheet produced by Lertap will be called ECStats1ul, or, more generally, ECStatsXul, where "X" corresponds to the subtest involved. If the ECStatsXul worksheet is active, clicking on the charts icon will get the quintile plots rolling.
Now, part of the process of setting up an external-criterion analysis involves selecting a score from the Scores worksheet; in fact, it's this score which defines the external criterion.
Lertap will check the selected score to see if it might correspond to a categorical variable, such as Gender or, perhaps, Region. (Note: the Recode macro available via the Move+ Menu is useful for working with categorical variables. This macro will, for example, allow variables coded with letters to be recoded with corresponding digits.)
If the selected score is found to consist of values in the range 1 to 5, Lertap will define the number of 'upper-lower' groups as equal to the number of different values found. For example, if the selected score has only values of 1 and 2, Lertap will set the number of upper-lower groups to 2. If the selected score has values of 1, 2, 3, and 4 (for example), Lertap will set the number of upper-lower groups to 4. (This action over-rides the number of upper-lower groups setting in the System worksheet.)
Here's a practical example: 288 junior high-school students participated in a test development project which investigated the effects of coaching on test performance. About half of the students sat a practice test before taking the real one. Did this affect their achievement?
Data were entered into a Lertap workbook. One of the columns in the Data worksheet indicated whether or not the student had taken the practice test; this column was called "Practice". Practice=1 indicated the student had not taken the practice test, while a Practice value of 2 indicated that the student had sat the practice test.
Another Data column contained a code for gender, 1 for boys, 2 for girls. Other columns housed the student responses to the 70 test items.
The CCs worksheet was set up to score the 70 test items. The Run menu was then used to Interpret CCs lines, and to produce an Elmillon item analysis.
We used the Move+ menu to copy the Practice column from the Data worksheet to the Scores worksheet. Then we went back to the Run menu and started an External criterion analysis, telling Lertap to use the Scores column with Practice values as the criterion "score".
Lertap dutifully produced two new worksheets, ECStats1f, and ECStats1ul. We had a squiz of the latter -- at the very end we observed this info:
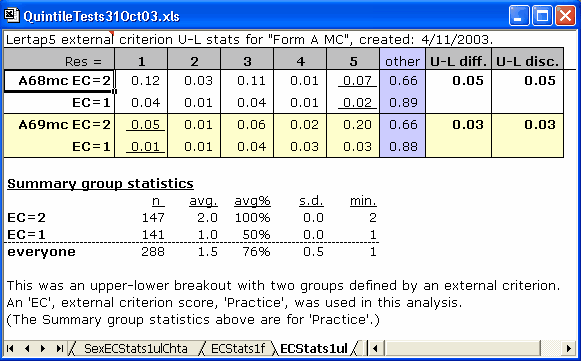
Lertap has denoted the two Practice values as EC=2, the Practice group, and EC=1. It will always do this, that is, always denote the categorical variable as "EC", appending its various values. Had there been four groups, we would have had EC=4, EC=3, EC=2, and EC=1.
Notice the two s.d. values? Zero point zero, and zero point zero. This is correct -- the groups have been defined by a categorical variable; all members of each group have the same "score" on this variable -- there is no variance of scores within the groups, no standard deviation.
We clicked on the charts icon once, and got a new worksheet called ECStats1ulChta. Next, we made the ECStats1ul sheet active (by clicking on its tab), and then clicked on the charts icon again to get ECStats1ulChtb.
What did we find? Most of the initial items had this sort of quintile-a plot:
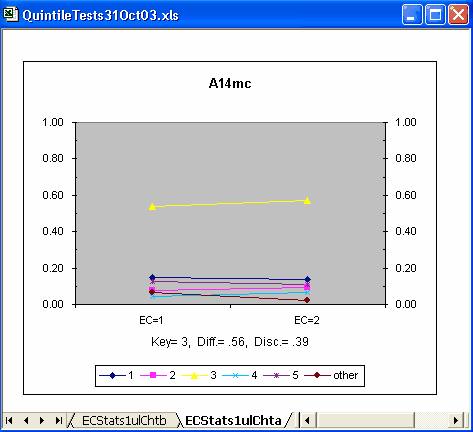
The plot above has lines which seem to be fairly horizontal -- we'd expect horizontal lines if there were no group differences -- truly horizontal lines indicate that the percentage of people selecting an option is the same in each group, meaning that there are no differences among the groups. (Some readers will recognise this discussion as being similar to that heard when folks sit down with their coffee / tea to yak about "item bias" and DIF, differential item functioning. Please see the Ibreaks topic for much more about DIF.)
Above, the proportion in each group selecting each of the four distractors looks to be about the same (except for "other"); the proportion of correct answers (Key= 3) was about the same in each group, perhaps showing a slight practice effect (the line rises somewhat as it moves from left to right).
But now look at item A36mc:
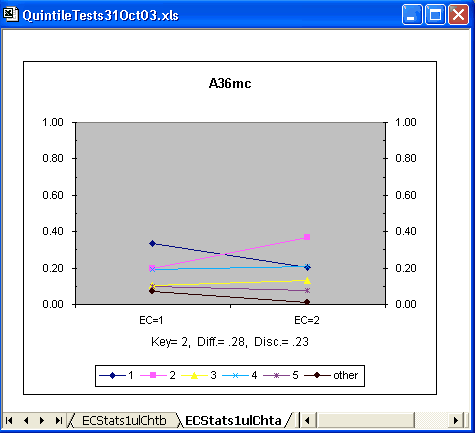
The proportion of people who identified the keyed-correct answer (2) was noticeably higher in the practice group. The lines are no longer all close to horizontal.
There were a few other items with patterns like A36mc's. However, it was a study of the quintile-b plots which highlighted a major message: the practice group stuck it out longer -- they answered more test items; students without practice tended to get bogged down, appearing to run out of time. Look:
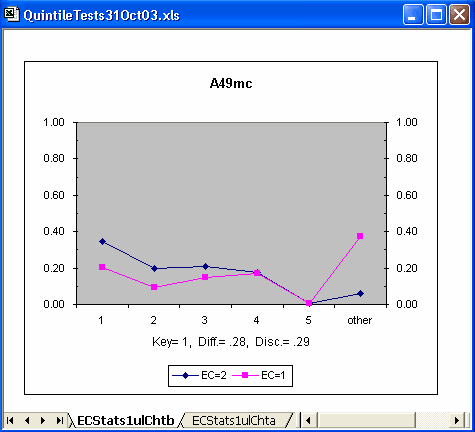
"Other" means a student omitted the item. Notice that almost 40% of the no-practice group omitted item A49mc, whereas the omit level in the practice group was below 10%. This pattern set in at item A49mc, and continued to the end of the test without exception. (Well, the gap did narrow somewhat after about the 65th item when the proportion of omits in the practice group began to rise rapidly.)
Of course we didn't need plots such as these to reach this finding. No; the numbers are all there in the source data, in the ECStats1ul worksheet. But you might agree that the plots are more effective in conveying the message. If there's a pattern in the data, plots such as these can help to uncover it.