Response similarity analysis
Response similarity analysis, RSA, involves getting Lertap to examine the answers from pairs of students to see if each pair's item responses might be unexpectedly similar. This sort of analysis is generally undertaken to see if some students might have colluded in creating their answers, something which is often considered to be "cheating".
If your data set involves "N" students, and if the objective is to compare all possible student pairs, the number of pairs will equal (N)(N-1)/2. When N=100, there will be (100)(99)/2 = 4,950 student pairs to compare. When N=5,000 there will be more than twelve million (> 12,000,000) student pairs to compare (!). But fear not: Lertap will crunch your pairs without a whinge, asking only that you muster some patience when N gets over 800 or so (see time trials below, and note that it's easy to pare the number of pairs (as it were) by selecting a subset of students, such as, perhaps, all those whose percentage-correct score is from, say, 40% to 95%).
An RSAdata worksheet forms the base for similarity analyses. RSAdata worksheets are made whenever the "Item scores and correlations" option is taken from the Run menu, and the RSA option has been set to "yes" in the System worksheet.
Once an RSAdata worksheet has been created, another option on the Run menu, "Response similarity Analysis (RSA)", will get Lertap to produce its three RSA reports: RSAcases, RSAtable, and RSAsig.
The RSAcases report is the bread and butter of Lertap's RSA analysis. Here's a typical sample:

An RSAcases report presents data for those pairs of students whose item responses have been judged to be "suspect", using criteria developed by Professors Harpp & Hogan.
The item responses given by each pair of students are found under the Responses column, using a format suggested in the "SCheck" program from Wesolowsky (2000): a full stop (or "period") indicates a correct answer. Each of the two students above had 20 correct answers.
The 2 seen at the start of each response string seen above indicates that both students selected "2" as their response to the first item. On this item, both students made what RSA classifies as an "error": they failed to find the correct answer. Not only did they both make an error, but they made an identical error on the item. Wherever the student incorrect responses match, they have an "exact error in common". It's pretty easy to see that the two students had nine matching errors, nine "exact errors in common". Over all 30 of their item responses, there were only two response differences.
The values of the Harpp-Hogan measures are found under the EEIC, Index, and Sigma columns of the RSAcases report. Briefly, Harpp-Hogan methods are based on (1), determining EEIC, the number of exact errors found in common in student responses; (2), comparing EEIC to "D", the total number of response differences found, a comparison made by dividing EEIC by D, producing the "Index"; (3), developing a response probability measure for the pair of students, and comparing it to a distribution of similar measures formed from non-suspect pairs. The probability measure is found under the "Log" column, with "Sigma" indicating how significant the pair's probability measure was.
EEIC, Index, and Sigma measures are computed for all pairs of students, not just for those whose results come to feature in the RSAcases report. When a pair's EEIC and Index measures are above preset cutoff values, the pair's results are said to be "suspect", meaning that the pattern of their answers to test items was, perhaps, suspicious.
All pairs found to be "suspect" are entered in the RSAcases report. To these the final Harpp-Hogan criterion is applied: if the Sigma measure for a suspect pair is above the preset Sigma cutoff value, the pair's results become "significantly suspect", or "very suspect". Their results receive special highlighting in RSAcases: a pink highlight is added to their ID, EEIC, Index, and Sigma entries (an example is seen above). It's these pairs which we might then investigate further. Did they have the opportunity to cheat during the exam? Were they seated close to each other? Were they seen to be using mobile phones, or noted to share the same eraser?
It is the nature of the RSA business to want to have a number representing the extent of possible cheating. In Lertap's RSA analysis, that number corresponds to the number of RSAcases pairs whose entries are "in the pink". When an RSAcases report has more than five entries, a small section at the end of the report summarizes results, as exemplified below:

In this example, the RSAcases report had 57 entries, 57 paired student results. Of these, 35 were "in the pink". We might say that our RSA analysis uncovered 35 pairs whose item responses were "significantly suspect", or, in Wesolowsky's terms, "excessively similar". We can't yet say for sure that they cheated, but we may well have reason to question their results.
More than one RSA analysis may be applied to the same RSAdata worksheet. As discussed below, there are several options which control how an RSA analysis runs; it is quite common to specify an analysis which looks not at all students, but only at those whose test scores fall within a certain range. In some cases, we might want to exclude "weak" test items from the analysis, as described below.
The RSAcases report conveys the essence of Lertap's analysis, but two other reports are produced for those who care to delve further into the results.
One of these is RSAtable, exemplified in the screen snapshot below:
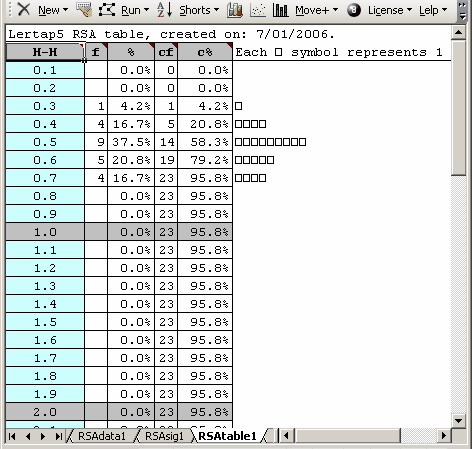
An RSAtable report "plots" the values of the Harpp-Hogan Index measure for all those pairs of students having an EEIC value at or above the preset cutoff. Most H-H Index values will be less than 1.0 in magnitude. To be noted is a special case: the H-H Index is a ratio, one whose denominator, "D", may be zero. When this occurs, Lertap sets H-H Index equal to a value of 999.
Lertap's RSAtable report is made to resemble Figures1, 2, and 3 in Harpp, Hogan, & Jennings (1996).
The RSAtable report is a hold-over from Lertap 5.5 where it was used as the main indicator of potential cheating, a role which has now been assumed by the RSAcases report.
The third Lertap RSA report is RSAsig, a worksheet which contains a wealth of information. RSAsig has three main areas: top, lower-left, and lower-right.
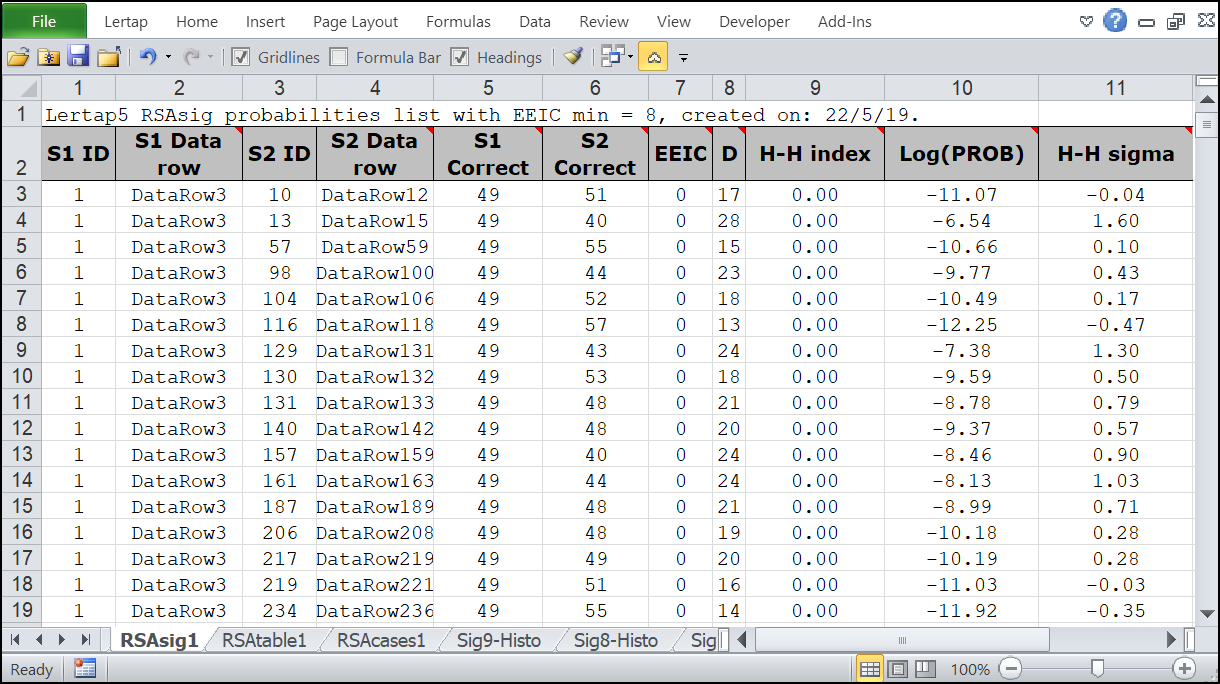
The top of a typical RSAsig report has been captured here. S1 and S2 refer to the first and second students in each pair. Such reports contain data pertaining to all student pairs whose item responses are not suspect; these are all those pairs with an EEIC value, and/or an Index value less than respective preset cutoff figures.
(Note: to be included in the RSA analysis, a student must have at least one answer wrong. Students with perfect scores, or totally imperfect scores (not a single correct answer) are excluded.)
The entries in the RSAsig report are sorted on column 9, from lowest H-H Index to highest. The Log(PROB) column, abbreviated as "Log" in RSAcases, is the logarithm of the Harpp-Hogan response probability measure, "PROB", described in Harpp & Hogan (1993).
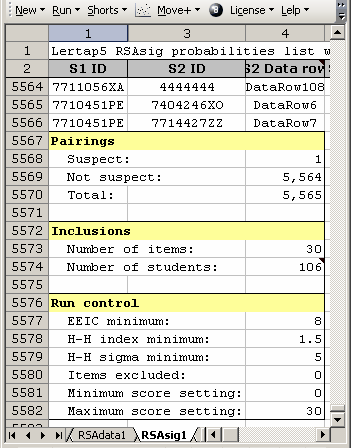
The lower-left portion of an RSAsig report is shown above. Only one suspect student pair was found in this analysis of 5,565 total student pairings. Thirty (30) items were involved in the analysis, and 106 students. Cutoff figures for the three Harpp-Hogan criteria are shown as "minimum" values under the "Run control" heading. No items were excluded from the analysis, and a score range of 0 to 30 was processed, corresponding to 0% correct to 100% correct since there were 30 test items.
Note: the "Number of students" excludes students with perfect scores (no wrong answers at all), and it also excludes students with totally imperfect scores (not even a single right answer).
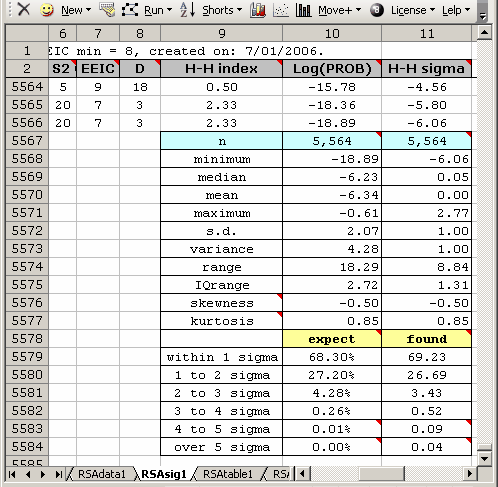
Above is a snapshot of the lower-right area of an RSAsig report. The descriptive statistics, from "minimum" to "kurtosis", have to do with the 5,564 Log(PROB) and H-H Sigma values found in rows 3 through 5566 of the worksheet.
The little "expect - found" table is used to gain an idea of how closely the Sigma values found followed those corresponding to the normal curve. Under a normal, or "Gaussian" distribution, 27.20% of all cases will lie between one and two standard deviations on either side of the mean; for the dataset above, 26.69% of actual cases were found in this region, slightly less than expected. It's clear that the results found for this dataset did not identically match what would have been expected under a true normal distribution, but they're perhaps not too bad.
Small triangles to the upper-right of an Excel cell signify that a comment has been attached to the cell. Letting the mouse hover over such a cell will cause the comment to appear, as seen below:
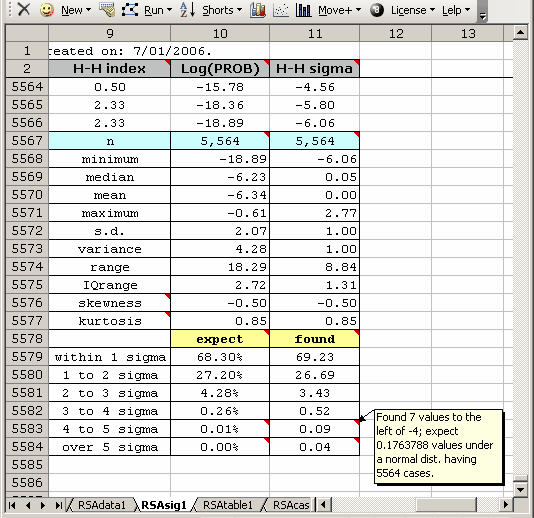
In this case, the comment informs us that seven (7) Sigma values were found to the left of -4 standard deviations, compared to the "0.1763788" values which we would expect to find under a normal curve.
It is easy to get Lertap to graph the Log(PROB) values. Do so by using the histogrammer routine.
The RSAsig report will, at times, differ a bit to the samples seen above. There's a limit to the number of rows an Excel worksheet may have; in Excel 2016 the limit was 1,048,576 rows. Whenever the number of student pairs exceeds a bit less than this number, Lertap stops entering results in RSAsig, but continues to compute a subset of the descriptive statistics (1,048,250 is the precise number of pairs which Lertap will presently report on, corresponding to 1,448 students). It then adds a small table with selected results for all student pairs, as exemplified here:
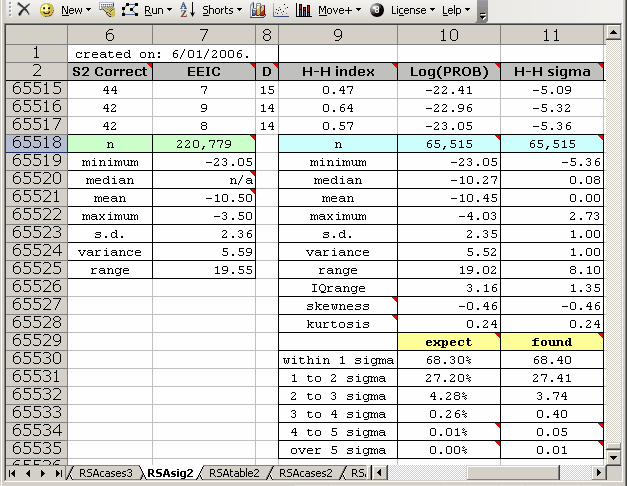
The little table on the left has Log(PROB) minimum, mean, maximum, s.d., variance, and range data for the 220779 student pairs involved in this analysis. We might now consider the 65515 cases whose statistics are given in the right-most table to be a sample from the whole; comparing the sample Log(PROB) mean and s.d. values (-10.45 and 2.35) to those for the population (-10.50 and 2.36) suggests that the sample data are representative.
(Please note that this example is from the Excel 2003 / 2004 versions of Lertap, where the number of rows in a worksheet was limited to 65,536. In the case of Excel 2010, the little table on the left will appear only when the number of students is greater than 1,448, corresponding to about 1,048,000 paired results.)
To read more about response similarity analysis, be sure to refer to the "Related tidbits" at the end of this topic. Of these, if you have time to read only one, make it "Using Lertap 5.6 to monitor cheating on multiple-choice exams".
Lertap's RSA settings
There's a fair smorgasbord of options which control how Lertap goes about its RSA work. Look at the following rows from the System worksheet:

Should an RSA worksheet be created?
If this option is set to “yes”, Lertap will produce a worksheet called RSAdata1 whenever the “Item scores and correlations” option is selected from Lertap’s Run menu. This is the core worksheet for all of Lertap’s RSA calculations. If Lertap is running in “production mode”, there will be one RSAdata worksheet for each subtest. Once an RSAdata worksheet has been created, the “Response similarity analysis (RSA)” option may be taken from the Run menu. It is this option which produces Lertap’s RSA reports.
Cutoff value for the Harpp-Hogan statistic:
This refers to the H-H index. Harpp and Hogan suggest a minimum of 1.5 for this index.
Minimum EEIC value:
EEIC means “exact errors in common”. The recommended minimum is 8, a value which might be lowered to 6 or 7 whenever the number of test items is less than 40.
Minimum sigma value to be an outlier:
Sigma refers to how far a student pair’s probability measure is from the mean of the distribution of probability measures. Sigma is a z-score. If the probability measures are normally distributed, a z-score of +5.0 or -5.0 more is a very rare outcome indeed—only 0.0000003 of the area under a normal distribution lies beyond a z-score of 5.0. In practical terms, an exam given to three thousand students will produce about five million pairings of students; if the students have not colluded in their item responses, only about two of the student pairs can be expected to have a sigma greater than 5.0, assuming that the distribution of probability measures follows a normal distribution.
Mark all records as pickable for RSA?
This option is, in fact, not yet an option. It may be activated at a future date. In the present version of Lertap, students may be excluded from an RSA analysis by removing the comment (the red triangle) from their RSAdata records; students will also be excluded if their test score does not fall within the range of scores specified by the minimum % and maximum % test score values set in the System worksheet (see immediately below).
Minimum % test score for RSA?
Maximum % test score for RSA?
These two settings determine which students will be included in any RSA analysis. A minimum of 0 (zero) and maximum of 100 will see all students included. Note that experienced users of Harpp Hogan methods will often run several RSA analyses for any given test. They may start with a 0%-100% range for these settings, or 40%-95%, and then reprocess the data with revised settings.
Allow on-the-fly min / max % test score reset?
If this option is set to “yes”, then Lertap will ask you to enter the minimum and maximum % test scores each time you select the “Response similarity analysis (RSA)” option from the Run menu. This completely over-rides the Minimum and Maximum % test score settings in the System worksheet.
Automatically exclude weak items?
For RSA work, “weak items” are those where the number of students selecting the item’s correct answer is less than the number selecting one of the distractors, or less than the number of students who omitted the item. If this option is set to “no”, then Lertap will pause every time it encounters a “weak item”, asking if you’d like to exclude it from the RSA analysis. If the option is set to “yes”, then weak items are automatically excluded. Excluding weak items is strongly recommended; if a test has weak items, the EEIC measure will be inflated, resulting in more “suspects pairs”, that is, more student pairs whose item responses may be judged suspiciously similar (possibly implying cheating). Is it common for tests to have weak items? Yes, it is; difficult items with poorly-functioning distractors will often fall under this definition of a weak item. Note that a “weak item”, in RSA terms, does not necessarily mean a bad item—bad items are, generally, those with a negative discrimination index; it is possible for an item to be weak, in RSA terms, but still have an adequate discrimination figure.
SCheck (Wesolowsky)
The RSA analyses mentioned above all have to do with how Lertap looks at the matter of response similarities. Lertap's procedures are based on those first developed by Harpp & Hogan at McGill University, Canada.
At another Canadian university, Wesolowsky has developed other methods for detecting excessive response similarities. Wesolowsky's SCheck program is based on them. Lertap's RSA procedures will automatically produce a file which will slip right into SCheck -- more about this in steps 2 and 4 below.
Summary of RSA steps
To review, here are the steps required in order to have Lertap do its RSA magic:
| 1. | You have to say "yes" to RSA in the right spot in Lertap's System worksheet. As this topic went to press, the right spot was row 25, column 2. |
| 2. | You must go to the Run menu, and click on "Item scores and correlations". This will produce the RSAdata worksheet, and also the SCheckData.DAT file. You'll be able to see the RSAdata worksheet right away as it will form part of your Excel workbook, but the SCheckData.DAT file becomes a separate entity, a file on its own, stored on your computer's hard disk. Where? Well, if you had saved your workbook prior to taking this step, it'll be saved in the same folder as your workbook (otherwise you may have to dig around to find it). |
| 3. | Next, back to the Run menu, and a click on "Response similarity analysis" if you want Lertap to make its RSAsig, RSAtable, and RSAcases reports. This option may be selected more than once, each time a new set of reports is created. Note: Lertap5 allows three of the RSA settings to be changed "on the fly" -- the Harpp-Hogan Index cutoff value, the minimum EEIC value, and the minimum sigma value may be changed as the RSA routine runs, over-riding the settings in the System worksheet for the duration of the run. This makes it possible to easily and quickly assess the impact of changing, for example, the minimum EEIC value -- this webpage has a related example. |
| 4. | For users with access to Professor Wesolowsky's SCheck.exe program: start SCheck.exe, and get it to work with the SCheckData.DAT file created by Lertap. Read more about SCheck by clicking here. (Note: another SCheck-related RSA worksheet is made by Lertap; it's a special one called "RSAcasesNosort". In some cases this usually-hidden worksheet will be useful even to general RSA users, not only those with SCheck.) |
Related comments
What about selecting a subset of data records before getting into Lertap's response similarity analysis? For example, what if you wanted to select only those students who took the exam in the Business school's main lecture hall? There are two ways you could get Lertap to cull out only the records you want.
One way is to use Lertap's *tst card on the CCs worksheet to select the desired records. Of course, you'd have to have a column in the Data worksheet which gives exam location information. Let's say this was column 3, in which case the *tst card might look like this:
*tst c3=(Business)
Another way is to use the 'Recode' option found under the Move+ menu, entering 'delete' for those records of no interest. The Recode option is more flexible than the *tst method, but it can involve more steps in some cases.
A third way (maybe the easiest) is to use the "NumericFilter2" macro, as described in this topic.
How about using Lertap's RSA support to simply get an estimate of the similarity problems which may pertain to a large data set? Maybe there's too much data, thousands or tens of thousands of students -- too many -- can we possibly get a random sample to work with? But of course. You'd want to read about Lertap's ability to let you Halve and Hold.
Time trials
Having Lertap do RSA things can take time, as you might expect.
From Lertap's viewpoint, there are usually two things to do: make the RSAdata worksheet, and then, when requested, make the suite of RSAsig, RSAtable, and RSAcases worksheets.
As mentioned, the RSAdata worksheet is created when the "Item scores and correlations" option is taken, and the "Should an RSA worksheet be created?" question has been set to "Yes" in the System worksheet.
The "Item scores and correlations" option usually runs fairly quickly; having it make the RSAdata worksheet is basically a trivial matter -- what makes the option work hard is something else: inverting the correlation matrix so that eigenvalues will be computed (row 22 in the System worksheet can be used to stop the inverter from being used).
What is most time consuming for Excel is the creation of the RSAsig, RSAtable, and RSAcases worksheets. For a dataset with 60 items, 500 students, EEIC min at 8, H-H cutoff at 1.5, and with all possible pairs of students included, Excel 2016 took slightly more than 10 minutes to complete its computations when running in the year 2019 on a laptop computer having an Intel Core i5-8250U CPU and 8.00 GB of installed RAM (quite a good laptop but there are certainly faster computers; the processors in laptops are often "clocked down" to save the battery). On the other hand, running on the same computer, Excel 2010 needed just under 3 minutes to do the job.
One thing to keep in mind here: it might not always make much sense to run RSA with data sets housing students from more than one exam venue. Because why? Well, think of what we're trying to figure out: are the item responses from any given pair of students surprisingly similar? If Joe sits the exam in Engineering, and Sally sits the same exam in Commerce, would we want to pose this question? What chance do Joe and Sally have to share exam answers?
We might have all test results in one Lertap Data worksheet, true, but when it comes time for RSA we might well want to break out records according to their exam venue. Interested in this idea? If yes, back up a few paragraphs and read the text around where *tst c3=(Business) is mentioned.
Note: some users of collusion detection programs suggest that it can be a good idea to refrain from breaking out results by venue as keeping all records, from all venues, may serve as a test of the program's ability to limit the number of false positives; the reasoning is that if we know that students like Joe and Sally had no way of sharing answers, then the detection algorithm should not flag them (the flag would be a false positive) -- if it does raise a flag then the quality of the algorithm may be called into question, especially when there might be quite a few of these 'false alarms'.
Finally, a closing comment: the literature in this area is interesting, and not ambiguous: make it unnecessary to use RSA software by randomly assigning students to seats in the exam venue, and, if possible, by using different test forms, with item scrambling.
Related tidbits:
RSA was used in early 2020 to see if examinees might be finding ways to cheat on exams when able to sit tests at home, under the eye of the "remote proctoring" methods that came to the fore during the COVID19 pandemic. Results from two certified accreditation examinations were compared. On Exam-A no evidence of cheating was found with the 3,000 examinees who took the test at various on-site proctoring examination centers. The same was found with Exam-B and the 2,000 examinees taking the test under on-site proctoring conditions. When testing centers closed for the COVID lockdown period, examinees had to shift to taking both exams under remote proctoring conditions, and Lertap5's RSA analyses did find some evidence of possible cheating among a small (but not insignificant) number of students. (An NCCA conference held late in 2020 was expected to focus, in part, on the rise of remote proctoring and any associated problems.)
Two practical examples of the application of RSA in a university setting may be found starting here; there's another real-life sample, a larger one used in a certification center, available by clicking here.
Lertap5 versions 5.10.9.2 dated after 30 June 2019 are programmed to sort the entries in RSAcases and RSAsig reports on the "Index" column (in RSAcases) and on the "H-H Index" column (in RSAsig), with highest values at the bottom. These are the same statistics, the "Harpp-Hogan index", with slightly different titles. It's possible to see what effect the EEIC cutoff setting has by looking at the last H-H Index values in the RSAsig report. If, for example, the EEIC cutoff is set at 8, those student pairs with EEIC at 6 and 7 will not be seen in RSAcases, but will be seen at the bottom of the RSAsig report. If the corresponding sigma values for such pairs are above the sigma cutoff level then these pairs will also show in RSAcases when the EEIC setting is lowered from 8 to 6. See this topic for a practical example.
For even more about these topics, see "Response Similarity Analysis", a 17-page Word document with lots of similar topics, available via the Internet: click here if you're connected. (Note that this document is quite dated but may be of interest for historical and background reasons.)
You'll surely want to take in a journal article submitted for publication in 2006: "Using selected indices to monitor cheating on multiple-choice exams", a PDF document, some 15 pages in length. This article mentions other software working in the area of cheating detection, such as Scrutiny!, Integrity, and SCheck.
Then, having looked at the journal article, which was critical of Harpp-Hogan methods, you'll have to take in the best-selling, riveting sequel, a paper which explains how Lertap was modified after Harpp & Hogan revised their original guidelines in response to the journal article. See "Using Lertap 5.6 to monitor cheating on multiple-choice exams".
