Run menu

Contents
The Run menu provides paths to Lertap's data analysis routines. It's used after all data have been recorded in the Data worksheet, and after control lines, or "cards", have been typed into the CCs worksheet.
A typical data analysis procedure consists of two steps. First, users click on the ![]() option. This gets Lertap to check the CCs lines for syntax errors, to "interpret" them. If no errors are found, Lertap goes on to produce the "Freqs" report, that is, a worksheet which summarises the response frequencies found in the columns of the Data worksheet. Which columns? The ones referenced by the *col lines in the CCs worksheet.
option. This gets Lertap to check the CCs lines for syntax errors, to "interpret" them. If no errors are found, Lertap goes on to produce the "Freqs" report, that is, a worksheet which summarises the response frequencies found in the columns of the Data worksheet. Which columns? The ones referenced by the *col lines in the CCs worksheet.
As part of the interpret CCs lines process, Lertap also writes some intermediate worksheets with data required by the Elmillon program. These are the "Sub" worksheets -- users with a keen eye can see the Sub worksheets being formed as Lertap goes about its business, but then, just before focus shifts to the Freqs worksheet, the Sub worksheets are hidden from view. Users usually have little need to see them; however, they're not secret -- they can be unhidden. There will be one Sub worksheet for each of the CCs worksheet's *col lines.
The second of Lertap's usual two-step data analysis process involves clicking on the ![]() option. This is the option which creates the various statistical reports which are Lertap's reason for being. Each of these reports is an Excel worksheet; they have names such as Stats1f, Stats1b, and Statsul.
option. This is the option which creates the various statistical reports which are Lertap's reason for being. Each of these reports is an Excel worksheet; they have names such as Stats1f, Stats1b, and Statsul.
Elmillon also produces scores, one for each subtest, or scale.
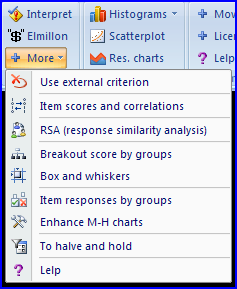
For more information on what the Run menu's options do, click on the topics shown in the boxes below:
Note: the Rasch Analysis option is not shown above. It is described here.