Brief item statistics (Stats1b)

Contents
Statsb reports are brief versions of the information found in Statsf reports.
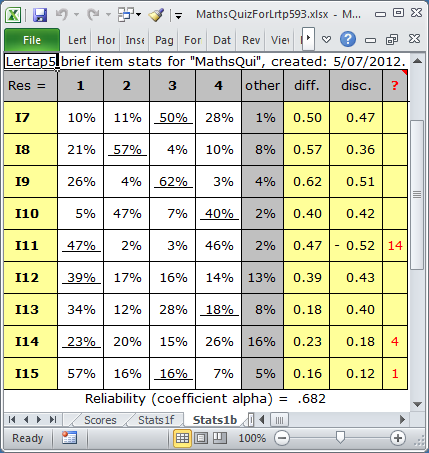
Part of a typical Statsb report for a cognitive test is shown above.
(Cognitive tests have a second part in Statsb, a plot of difficulty and discrimination: see examples in the next topic.)
Results for each item are presented in a single row. The percentage figures reflect the popularity of each item option, that is, the percentage of students who selected the option. This is the same as "p" in the corresponding Statsf report.
The keyed-correct option's results are underlined. (If an item has more than one keyed-correct option, results for each option are underlined.)
The "other" column gives the percentage of students who did not answer the item, or had an invalid response. Invalid responses are, for example, responses which have been incorrectly entered in the Data worksheet, resulting, perhaps, from a typing mistake. Invalid responses may also result from the use of an optical scanner. "Bubble" answer sheets are used with scanners; students will sometimes shade in more than one bubble for an item, resulting in the scanner using an invalid response code of some sort (such as an asterisk, or a "9").
Item difficulty appears in the "diff." column. If an item has only one keyed-correct option, then diff. will be the same as "p" for the correct answer in the corresponding Statsf report. If an item has more than one keyed-correct option, the percentages for each of these options are summed to get an overall figure.
The "disc." column is the item's discrimination figure. It will be the same as the pb(r) value seen in the corresponding Statsf report if the item has only one correct answer. When an item has more than one correct answer, then disc. is the Pearson product-moment correlation between the item and the criterion score, corrected for part-whole inflation.
The ? mark column is used to flag potential problems. Click here to read more about these flags.
A Statsb report for affective items will differ substantially.
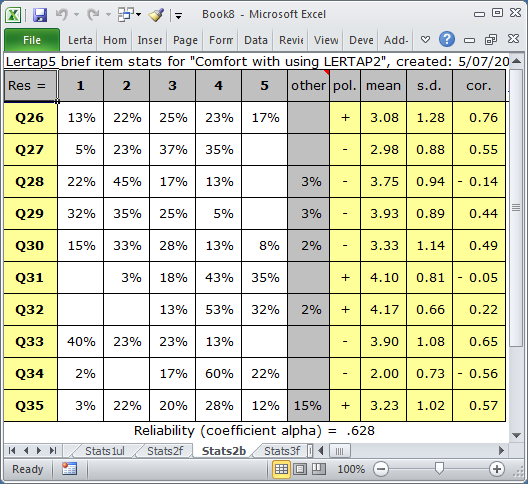
A typical Statsb report for an affective test is shown above.
The "pol." column indicates the "polarity" of the item; if the item has been reverse-scored, then the polarity will be negative.
The item's average score is found in the "mean" column. Its standard deviation is seen under "s.d.", and the correlation of the item with the criterion score, corrected for part-whole inflation, is under the "cor." column. As is the case in other Lertap output, the standard deviation is that for the population (the equation used has "n" in the denominator, not "n-1"). The correlation is a Pearson product-moment coefficient.
A plot of item "cor." values will be found at the bottom of Statsb reports (see examples here).
Missing data can have an effect on the statistics found in many of Lertap's reports, including Statsb. Read more about it here.
Related tidbits:
How to print Lertap's reports? Not hard at all, especially if you take in this topic.
The StatsbSortAZ special macro may be used to sort a Stats_b report, such as Stats1b, on the basis of item difficulty or item discrimination.
Summary statistics for item difficulty and discrimination are now found in Stats_b reports, providing users have Lertap version 5.10.7.2 or later. The Stats1b and Stats2b screen snapshots at the bottom of this topic display these statistics, mean and standard deviation, at the base of the difficulty and discrimination columns.