SMCs

Contents
An item's SMC value, its squared multiple correlation, indicates the proportion of the item's variance which may be linked to, or predicted from, the other items in the subtest. As mentioned in the previous topic, the SMC is sometimes used as an estimate of the amount of variance any single item has in common with the other items.
For technical discussions on the SMC, and its calculation, see Pedhazur & Schmelkin (1991, pp. 414-417), Lord & Novick (1968, pp. 265-266), Hays (1973, pp. 705-708), and Glass & Stanley (1970, pp. 186-191), or search the Internet for "multiple correlation coefficient". (To get to the Lertap references page, begin with a click here.)
Lertap's IStats worksheet gives some prominence to SMC values by "banding" them. Help your little self to a squiz of the following sample:
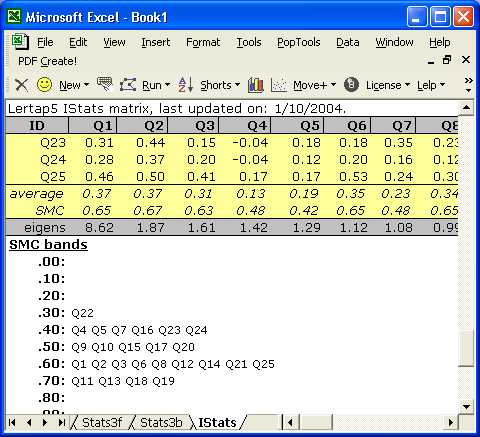
As seen above, the IStats report now has a row with SMC values (just above the eigens row), followed by a display of SMC bands.
The bands give a quick idea of the spread of SMC values -- we see, for example, that nine subtest items had an SMC value equal to or greater than 0.60, but less than 0.70. Among these nine were Q1, Q2, Q3, Q6, and Q8 -- you can see the actual SMC values for these five items by looking at the row of SMC values showing above the bands.
In this case, we see that Q2's SMC was 0.67. We may interpret this as meaning that 67% of Q2's variance can be explained by the other items in the subtest. If we took the square root of Q2's SMC, we'd get 0.82, a value we may interpret as indicating the correlation between Q2 and the other items. (In somewhat more technical lingo, 0.82 is the value of the Pearson product-moment correlation coefficient between the scores people earned on Q2 and a specially-weighted linear composite score formed from the other items. The "special weights" are determined via a multiple linear regression analysis, as the references point out.)
Now, you'll remember that there is another Lertap report which indicates how an item correlates with the other items in the subtest.
There is?
Sure. Look at the item discrimination bands seen in the following screen snippet:
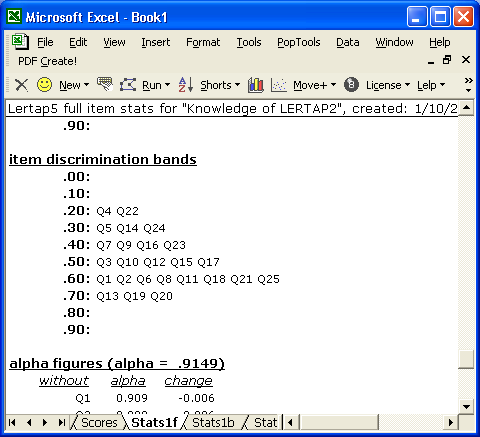
In Lertap, the standard index of item discrimination (or, for affective subtests, the item correlation) is the correlation between the item and a person's score derived by summing over all the other items in the subtest. (There is more about this in the manual.)
Note where Q2's discrimination index falls: in the 0.60 band. If we could scroll up the Stats1f report, or page over to the corresponding Stats1b report, we'd find Q2's correlation to be 0.66.
We have, then, two measures of Q2's correlation with the other subtest items, 0.82 and 0.66. Both figures represent the correlation between Q2 and a composite score formed by adding together the scores on the other subtest items; the SMC-based correlation will always be equal to or greater than the other correlation as it, the SMC-based value, is derived by using the special weights resulting from the multiple linear regression analysis underpinning the calculation of the SMC.
What do you have to do to get Lertap to produce SMC values? Nothing much, really, whenever you use the Run menu's option to "Output item scores matrix", the resultant IStats report will automatically include the row of SMC values, and the little table with SMC bands, as seen above.
What, then, is the SMC setting mentioned in the previous topic? It's a setting which determines whether or not the diagonal values of the IStats correlation matrix has 1's or SMCs. Why do some users want to have SMCs on the diagonal? Often because they're thinking of using the correlation matrix as input to a factor analysis program.
A discussion and example of using Lertap 5's output with other programs, such as SPSS, is available via this link.