Results

Contents
To get results, the student followed the three steps introduced in an earlier topic.
2) Use the Interpret option on the Lertap tab.
3) Use the Elmillon option on the Lertap tab. |
The Interpret option produced the "Freqs" worksheet seen below:
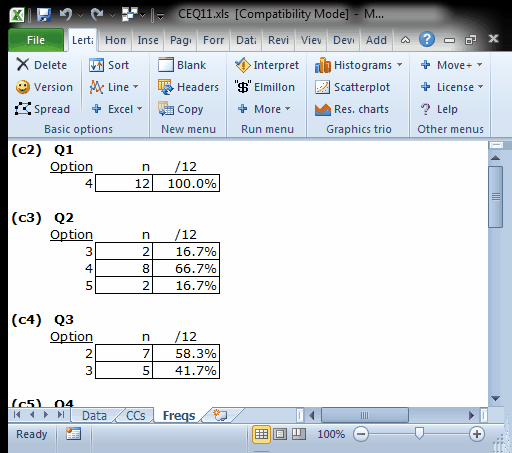
The Freqs report was examined to see if there were any unexpected responses, such as, for example, a 7, which would represent a data processing error (responses were supposed to be coded as 1, 2, 3, 4, or 5). The student found no errors of this sort, so she went on to use Elmillon.
Elmillon always finishes by placing the focus on the Stats1b report.
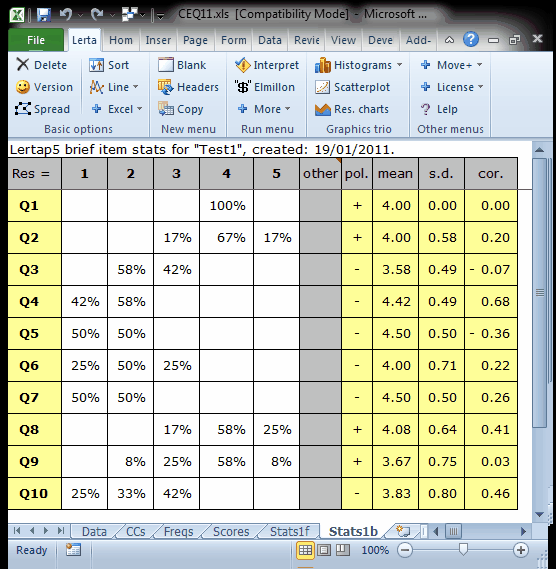
The column headed "mean" gives the average response score for each item, with negative items reverse scored. The highest possible mean for any item is 5.00; an item with a mean of 3.00 would indicate that, on average, the principals were undecided about the item's statement. In this case, seven of the 10 items have means which are at or above the "agree" score of 4. (This is equivalent to "disagree" on the negative items.)
The Stats1b report gives the honours student the information needed to summarise the principals' responses on an item by item basis. They had the most positive response, on average, to items 5 and 7. Read up a bit more about Stas1b and its stats by a click.
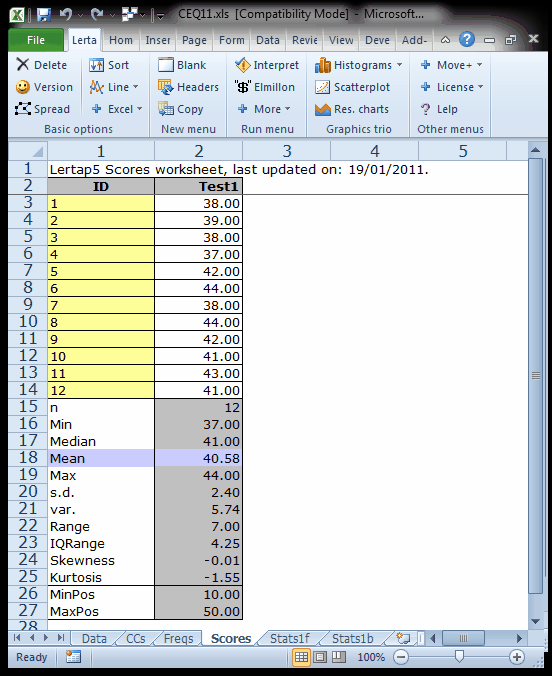
But the student had wanted to do more with the results. She had hoped to use the scale scores found in the Scores report for a portion of her dissertation:
Scale reliability is an important issue when using measures like the CEQ. It is often said that an affective scale should have a reliability of at least 0.70. Did this one, when given to the 12 Dunedin principals? The answer is found in the Stats1f report:

In this case the reliability was 0.45, quite less than the affective scale benchmark minimum of 0.70. This does not imply that the questionnaire was inadequate. What it means is that the scale scores cannot be used with any confidence: low reliability means high measurement error. The honours student had to get by with reporting her results using item data only, such as those given in the Stats1b report. This was by no means a bad outcome at all. The student wanted to know how principals felt about computers in schools, and their responses to each of the 10 items, combined with selected response charts (see the next topic), plus follow-up interviews with some principals, provided sufficient fuel for her honours dissertation.
(It was found that many of the principals had been under some pressure from parents who felt that their children might be left behind if not introduced to computers. Another great factor was financial: unless the school's budget could be increased, spending money on computers meant that other areas of the budget would have to be cut back. Some of the parent organisations started to organise cake drives to help raise funds for the schools.)