Doing more with Scores

Contents
Once a Scores worksheet has been created, there are a few icons on the Lertap tab which let you do more with them:
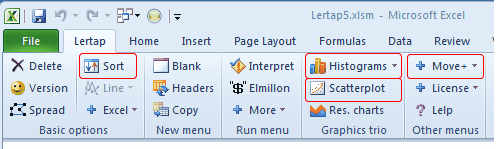
Click on the red boxes to branch out to corresponding topics.
(If the red boxes are not "hot" with your browser, try 'em here: Sort Histograms Scatterplot Move+ )
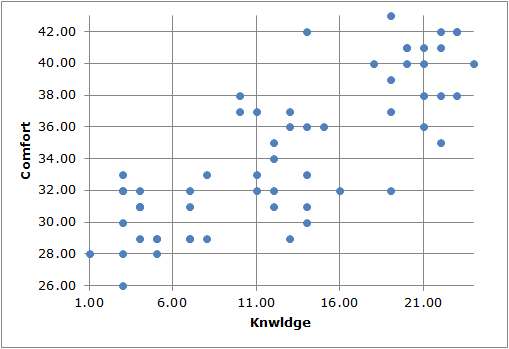
Samples of the graphs produced by the histogram and scatterplot options are shown below:

The next topic gets into the matter of missing data, and might be too technical for those on the Cook's Tour. We suggest you give missing data a miss, and jump to the first of Lertap's reports.