Full statistics (cognitive)

Contents
The Stats1f worksheet contains a wealth of information, presented in several sections.
The first section gives detailed statistics for each item, as seen here:
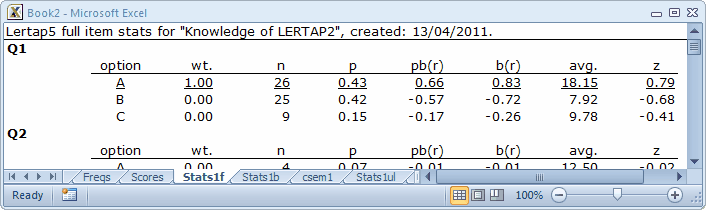
The “wt.” column indicates the number of points associated with each possible response option. “p” is “n” as a proportion, and corresponds to the percentage figures seen in the corresponding brief statistics worksheet. The “pb(r)” column indicates the point-biserial correlation of each response with the criterion score, while “b(r)” is the biserial equivalent. If an item has only one correct answer, the pb(r) figure corresponding to it is what is carried over to the corresponding brief statistics sheet, Stats1b, where it is displayed under the “disc.” column.
The “avg.” column displays the average criterion score for the people who selected each response option. For Q1, 26 people selected option A. Their average criterion score was 18.15. The “z” column converts the “avg.” figure to a z-score, using mean and standard deviation values for the criterion score.
Lertap’s default criterion score is an internal one, equal to the subtest score. It is possible to set up an external criterion analysis via one of the toolbar’s Run options.
Lertap has a studied look at the performance of each item’s distractors, that is, their wrong answers. If these options are doing their job, they should, first of all, truly distract people—they should be selected by someone. If no-one falls for a distractor, Lertap indicates this by listing the distractor under the ? column of the brief statistics worksheet.
The people who are distracted by the distractors should, in theory, be those whose mastery of the test material is below average. Below average is readily signalled by negative z-scores.
An unwanted outcome for a distractor is a positive z-score, which means that the people who took the “distractor” had above-average criterion scores. When this happens we usually think that the item has perhaps been mis-keyed (that is, the *key line of correct answers in the CCs worksheet may be in error). If it’s not mis-keyed, we then tend to think that the option has some intrinsic or extrinsic ambiguity, and requires repair. Distractors such as these, with positive z-scores, are also listed under the ? column of the corresponding brief statistics sheet, Stats1b.
The second section in the Stats1f sheet is the Summary Statistics part:
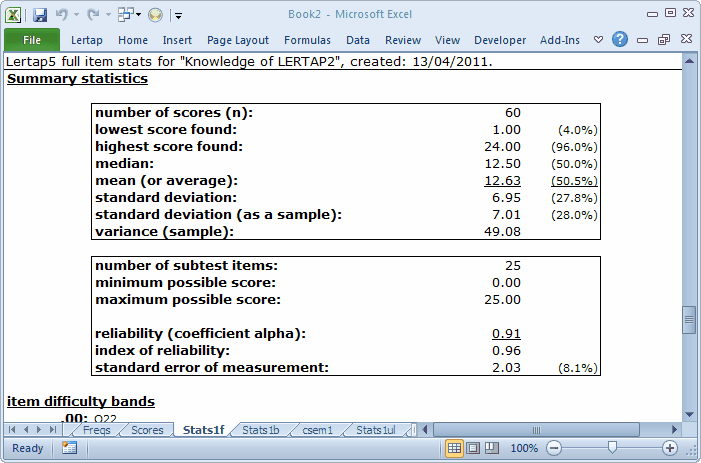
Much of the information found in this section is also found at the bottom of the Scores worksheet. However, the subtest reliability information is only found here, in this section of the Stats1f sheet.
The Summary Statistics section is followed by two subsections with “bands”:
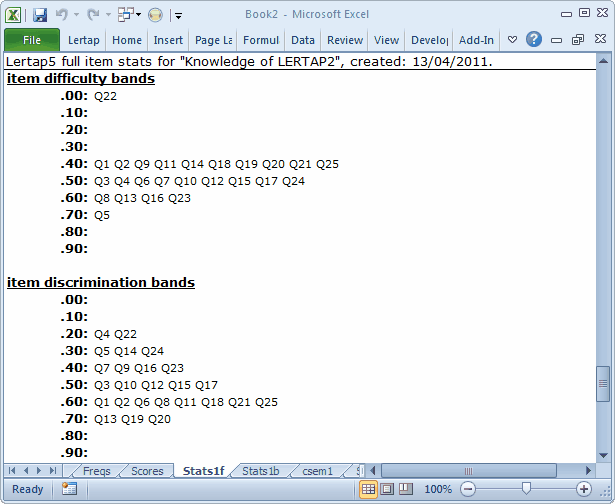
These bands summarise difficulty and discrimination data for the subtest’s items; they’re meant to make it possible to quickly see which items have performed the best, and which may require further study.
In the present example, Q22 falls into the lowest difficulty band, .00, meaning that it was a very hard item in this group of test takers. Q22 joins Q4 in having the lowest discrimination figure.
These bands are based on the complete item statistics results shown in the first part of the Stats1f output. To find the exact difficulty and discrimination values for any item, scroll up in the Stats1f sheet, or look in the Stats1b sheet. Remember that Excel, like Word, allows for its viewing window to be split, something which makes it easier to see different parts of the same sheet at once.
The bands are followed by the last subsection:
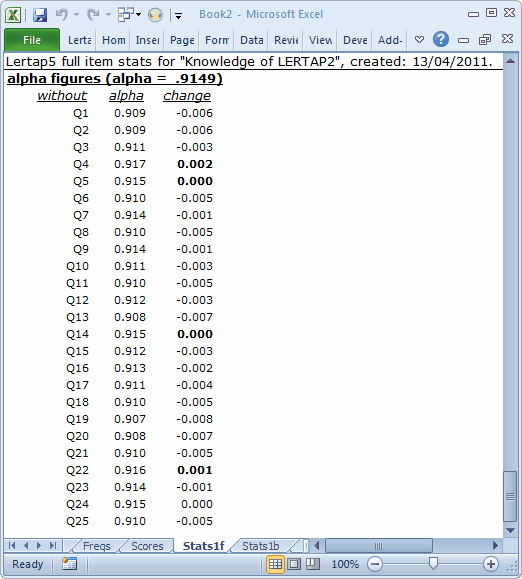
This section (above) makes it possible to see how subtest reliability would be affected if an item were deleted from the subtest. Without Q4, for example, the subtest’s reliability index, alpha, would be 0.917, an increase (improvement) of 0.002.
Next, uppers and downers lowers.