Sample Results

Contents
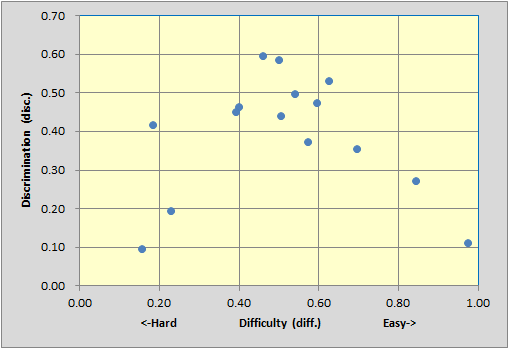
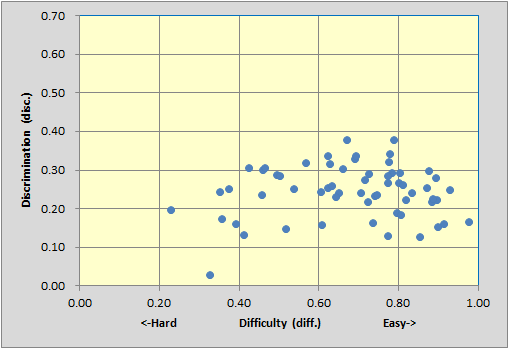
Before getting into some of the results for this test, consider the following three scatterplots from selected Stats1b reports (the last one of these three pertains to this test):
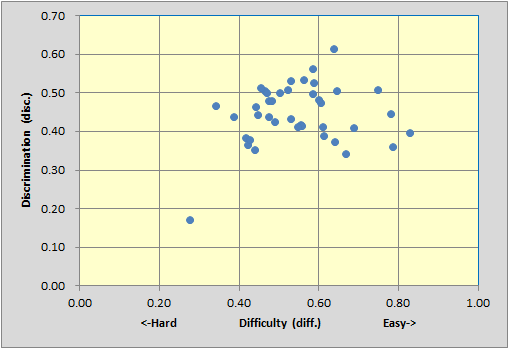
The top scatter is from a 40-item test with reliability (coefficient alpha) of 0.92.
The middle scatter is from our 15-item MathsQuiz with reliability 0.80 (with I11's key corrected).
The bottom scatter is from the 60-item nursing test with reliability of 0.82.
Is is well known that, all things being equal, a longer test will have better reliability than a shorter one. One way to increase the reliability of a test is to add more items to it.
The Spearman-Brown prophecy formula is used to calculate what the reliability of a test would be if it were lengthened by adding more items. We will pretend to add items to the top and middle tests to bring them up to 60 items. This will enable some interesting comparisons to be made.
For the 40-item test, making it a 60-item test by adding another 20 items of similar quality, and then applying Spearman-Brown, would bring the reliability to 0.945. Adding 45 items to the 15-item test would raise its reliability to 0.941. We would then have three tests, each with 60 items. Two have reliabilities bordering on 0.94, while one, the nursing exam, has a lower reliability figure, just 0.82.
Why is it that our 60-item nursing exam's reliability is considerably lower than that found for the other two 60-item tests?
Is there something about the top and middle scatterplots which distinguishes them from the bottom one? Yes, for sure. The big difference is that the bottom test has no items with disc. figures above 0.40. Tests will have better reliability as their items come to be more discriminating. In turn, item discrimination is related to item difficulty -- very difficult items, where, say, only 10% get the item right, and very easy items, where only 10% get the item wrong, are obviously not discriminating.
Well and good? Well, maybe not. The nursing exam is a mastery test. Such tests are often intentionally designed to have a greater proportion of items which tend to be relatively easy. This will limit item discrimination figures which, in turn, will serve to bring down reliability, at least as measured by coefficient alpha.
When a *sub line includes the word mastery, Lertap significantly alters one of its reports: Stats1ul. (The other two reports, Stats1b and Stats1f, are not affected by using the word mastery on *sub.)
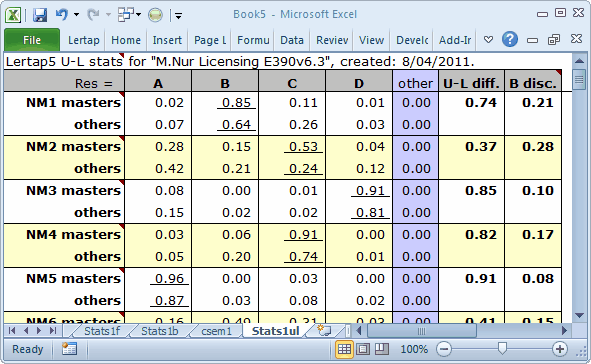
Test takers have now been classified as "masters" if their test scores are 70% or greater. Otherwise, they fall into what Lertap calls the "others" group.
Stats1ul item summaries indicate the proportion in each group selecting an item option, with the proportions corresponding to the keyed-correct answer underlined.
The "B disc." figure is simply the difference between the proportion correct for the two groups (Brennan, 1972).

The summary group statistics indicate that 960 students failed to reach the mastery score on this test. This is a substantial number, corresponding to 54% of the students.
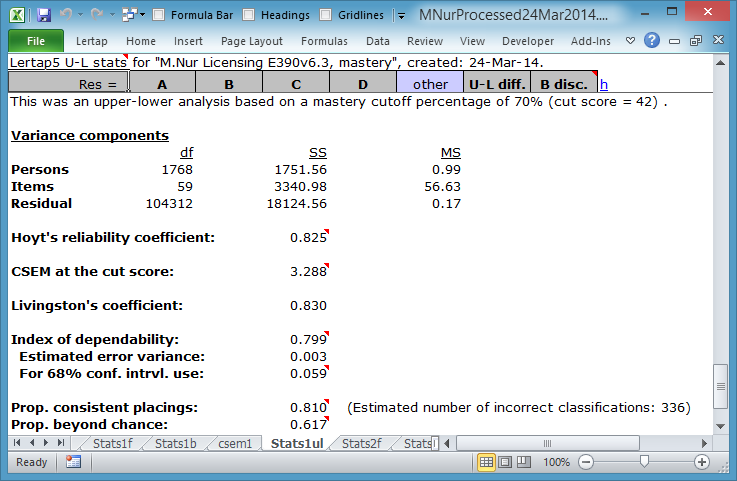
The bottom of the Stats1ul report for the mastery test analysis displays statistics discussed in Chapter 7 of the manual, in a technical paper on the use of cut scores in Lertap, and, most completely, in "Lelp", Lertap's online help system.
Of these statistics, the "Prop. consistent placings:", at 0.810, suggests that about 81% of the test takers have been correctly classified as being either in the "masters" group, or the "others" group. If we could test the same students again, the great majority, about 81%, would end up with the same classification.
This is what is meant by "classification consistency"‑‑we've used the test once as a means of classifying the students, finding some to be "masters" and others not masters. Now, let's imagine that it's possible to use the test again, just as a check: how many of the students will end up with the same classification?
Hopefully it'll be all of them, but in reality this will seldom be the case. In this M.Nursing example we have a classification consistency estimate of 81%. The implication is that 19% of the students might be expected to change if we could test them again. Some students will go from "masters" to "others"; some students will go from "others" to "masters". This is approximately a fifth of the students, some 336 of them (something to think about, isn't it?).
For more about classification consistency, read that technical paper. And see the "La Florida" sample too — one of the two tests used in La Florida had a classification consistency, as measured by "Prop. consistent placings", of over 96%.
Tidbits:
It is possible for a test to have items with good discrimination, and yet end up with relatively low reliability. This may happen (for example) when the test is not "pure", that is, has items which are really testing different, and relatively unrelated, things, or "factors". A principal components analysis may be used to see if this might be happening; read about it in one of the Lertap "erudite epistles". (It's the "About eigenvalues, scree tests, and coefficient alpha" paper; Download it if you'd like. Read about Lertap and principal components here.)
The technical paper referred to just above about the use of cut scores points out that a test may have low reliability, and yet have a high "Prop. consistent placings". Here's another chance to download it.