Sample results, page 2
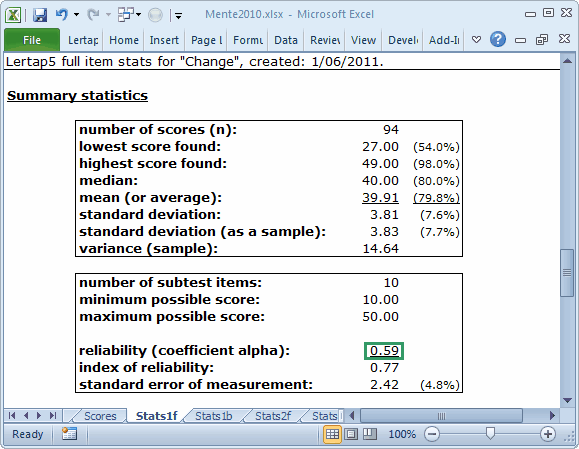
What a difference a minus sign or two (or three, ...) can make. See for yourself:
The CCs lines were changed by adding appropriate *pol lines:


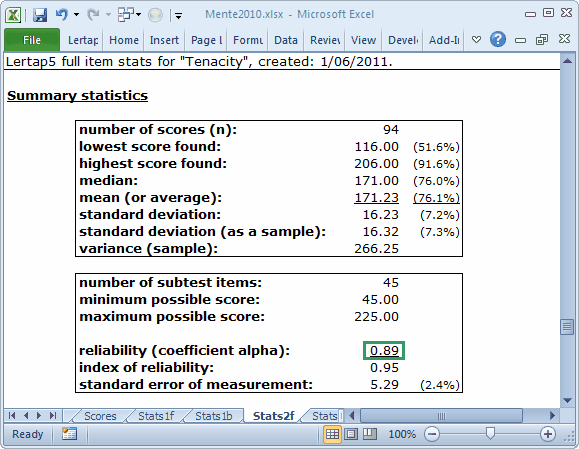
Quite an improvement, eh? Both reliability figures have gone up.
That for the "tenacity" scale, 0.89, is especially nice. The scale still has 45 items, more than desired, but the chances of ending up with a scale having just 40 items, and a reliability of possibly 0.80, would seem to be good.
How to determine which of the 45 items might be weeded out is something many people would attempt by using factor analysis.
Alas, Lertap does not yet have a factor analysis routine. However, it is able to extract the first principal component from the interitem correlation matrix. This is done via the "Item scores and correlations" option found under the Run menu. A click here will zip you off to related help topics.
(The SPSS package is often used for factor and components analysis. Jump to a topic which discusses importing Lertap data with SPSS.)
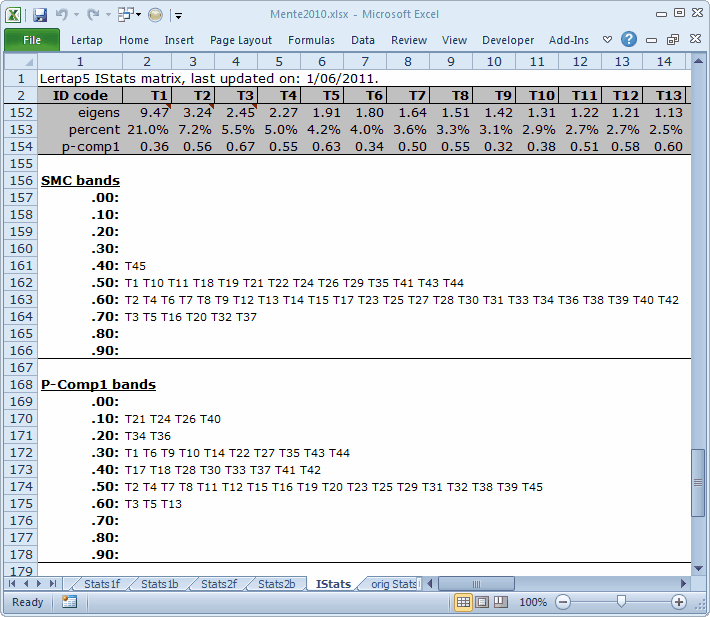
The screen snapshot below is an example of the "IStats" report created by this option.

There are six items whose correlations with the first principal component are below 0.30. Their item ID numbers are seen in the P-Comp1 bands.
The following CCs lines include a new subtest, "Tenacty2", with a *exc line which serves to eliminate these six items from the scale (the first item to be omitted is T21, which is located in c32 of the Data worksheet).

Wouldn't you like to know what the reliability of the new subtest was? We've eliminated six items, now running with a scale having just 39 items, and the reliability has ... has what? Do it yourself. Download the workbook, and give it a go. You'll be surprised if you do; the reliability actually increases.
Tidbits:
Why did we call the new subtest "Tenacty2" instead of "Tenacity2"? Because we know that Lertap allows a maximum of 8 characters for the title= assignment. If the title is longer than eight characters, it gets truncated. "Tenacity2" would have shown up as just "Tenacity" in Lertap's various reports.
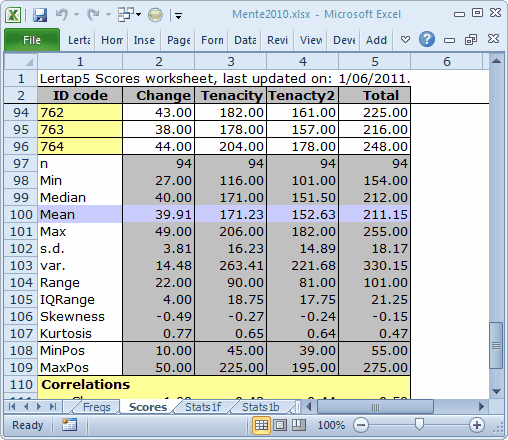
What's accomplished by using wt=0 on Tenacty2's *sub line? It keeps the new "Tenacty2" score from entering into the Total composite score value in the Scores worksheet:

Principal components analysis is discussed in one of the Lertap "erudite epistles". (It's the "About eigenvalues, scree tests, and coefficient alpha" paper; Download it if you'd like. Read about Lertap and principal components here.)
