Sample results at half time
Always check your data before going out, Mom would say.
Okay, starting with Freqs:

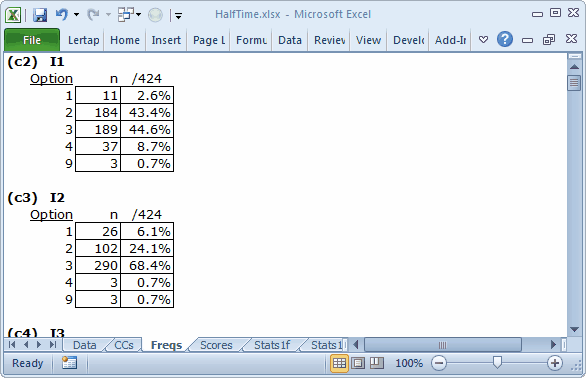
We scrolled down all of the little Freqs tables, looking for "weird" responses, that is, responses which were not 1 2 3 4 (these are the response codes used by each item, sometimes called the "options").
Freqs is trained to report the occurrence of all the 26 letters in the Latin alphabet, upper- and lower-case, as well as the 10 digits, from 0 through 9. If it finds any other characters in the item response columns of the Data worksheet, such as blanks and asterisks, it tallies them in a special row, the ? row.
Almost all of the HalfTime items have "responses" of 9. I1 and I2 had three 9s, as you can see above. In this case, HalfTime, 9s were what the scanner "recorded" whenever it found that a student did not answer an item, or gave more than one answer by shading in more than one bubble on the mark-sense answer sheet.
A few 9s will not discourage us; it is common for students to leave questions unanswered, even when we tell them to guess if they don't know the answer.
What we don't want to find are rows in the Data worksheet which have many, many 9s. Freqs can't tell us this. But, if there are such records, the corresponding test score will be low, possibly even zero. Lertap's traditional (old-style) histogram can indicate if there might be any really low scores, and it's very easy to get:

The Histo1L report's second column, highlighted in blue-gray, shows that the lowest "Whole" HalfTime score was 17. One student had this score. One student had a score of 18. Three had a score of 19. This looks fine; there are no "outliers", low scores which stand on their own -- here, for example, a score of 0 (zero) would have been an outlier, a "weird", unexpected result, probably from a bad results record in the Data worksheet. The M.Nursing sample has an example of a score outlier.
Having followed Mom's advice to check our data, we can now look at some results.
Look at the bottom of the Scores report:

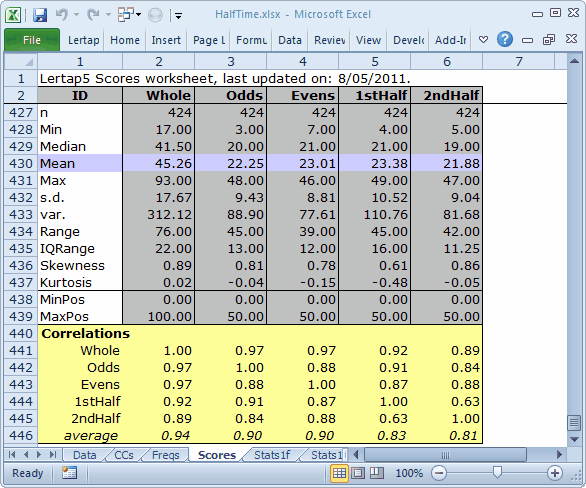
This was not exactly an easy test. MaxPos, the maximum possible score, was 100 on the "Whole" test, and the median score was 41.50. The medians for the four half tests were in the same ballpark, in the 22 to 23 range.
People who work with split-halves will often look at the correlation between respective halves as a reliability figure. This being the case, the split-half reliability for odds-evens would be 0.88. What is surprising is the split-half reliability for 1stHalf-2ndHalf. It's only 0.63.
Here's a summary of the coefficient alpha reliability figures from the various subtests:
Report Name |
Subtest Name |
No. Items |
Alpha |
Stats1f |
Whole |
100 |
0.93 |
Stats2f |
Odds |
50 |
0.88 |
Stats3f |
Evens |
50 |
0.87 |
Stats4f |
1stHalf |
50 |
0.91 |
Stats5f |
2ndHalf |
50 |
0.87 |
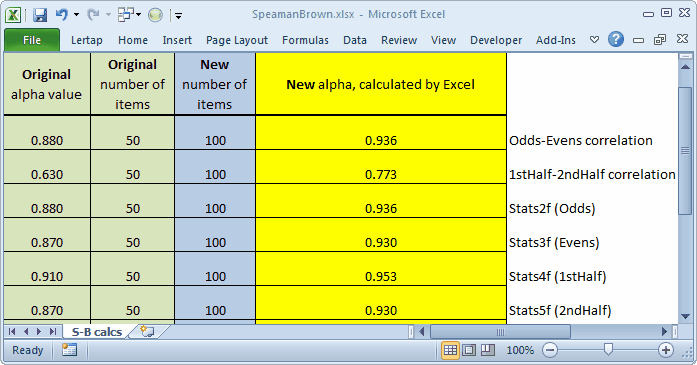
The reliability of a half test is generally expected to be lower than that for the full test, so we'll trot out our Spearman-Brown calculator to estimate the reliability of each half test if, instead of 50 items, it had 100. (Note: if clicking on the link doesn't get the calculator spreadsheet to download, right-click on it and select "save as".)

Please keep in mind that our main goal here relates to showing how to use Lertap. There may very well be people in the audience who are full-bottle on split-half methods, and we know that they might be saying that the Spearman-Brown formula is not the best way to estimate the reliability of a longer test unless the halves have the same standard deviations (s.d.). When standard deviations are unequal, Rulon's method is preferred over Spearman-Brown (search the internet for "Rulon's method" or "Rulon's formula" or "Rulon split-half").
Of great relevance here is this (Crocker & Algina, 1986, p. 142): coefficient alpha "... is the mean of all possible split-half coefficients that are calculated using the Rulon method ....".
Well, you okay with this stuff? Why not have a little download of HalfTime, and explore more on your own?
