The Freqs worksheet

Contents
“Freqs” means “Frequencies”. When you ask Lertap to “Interpret”, it does a bit more than check the syntax of the CCs lines, and write those Sub worksheets—it has a close look at the data columns referenced in CCs *col lines, and makes a tally of response popularities. Look:

The Freqs sheet contains information which even a rocket scientist might be able to understand, hopefully with little trouble.
For each item, or question, Freqs reports on the number of times letters or digits were found in the respective item column number in the Data worksheet. For Q1 there were 26 As, 25 Bs, and 9 Cs. The (c3) next to Q1 indicates that these responses were found in column 3 of the Data worksheet.
The Freqs column headed “/60” indicates that a total of 60 data records were found, and gives the percentage associated with each frequency. For example, there were 26 As for Q1, which is 43.3% of the total number of 60.
As you scroll through your own Freqs sheet, you’ll come across some rows which have a ? mark on the left. For example:
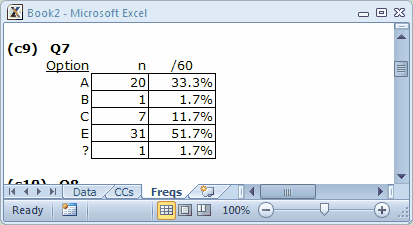
What Freqs is saying is that there was one response on Q7 which was not a letter or a digit. You can find out what it was by going back to the Data sheet, and browsing down the column with Q7 responses (column 9). If you do this, you’ll find a blank at R17C9, that is, Row 17, Column 9. If you were able to question the perpetrators of the Lertap Quiz, they’d tell you that blanks mean a person did not answer the question.
Why doesn’t Freqs show a “D” for Q7? Because nobody chose that option.
While being mindful of Freqs’ feelings, we can point out that it’s a simple, no-nonsense summary of response frequencies. It has no pretences; it does not claim to be sophisticated.
But it’s useful, isn’t it? It quickly summarises what went on in the data set. And, very importantly, it’s a sure-fire way to see if there are any weird responses in the data columns. For example, if the Q7 tally had included an X, that would be weird as only responses A though F were valid.
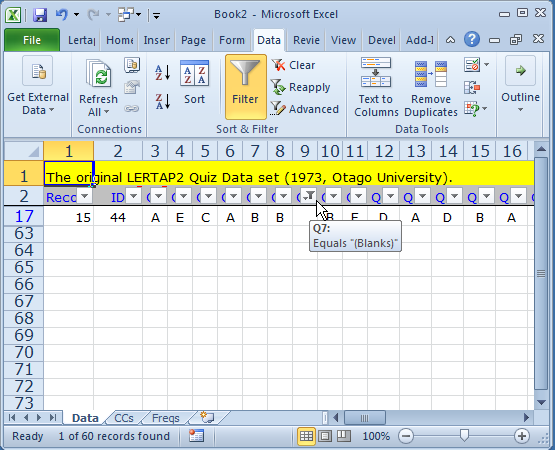
What if you do see weird results in Freqs, and want to quickly find the responsible records in the Data worksheet? The Data tab on the Excel ribbon has a "Filter" option, a powerful resource which will let you rapidly find records which have “weird” results.
Here's a snap of Filter in action. We asked it to find all records with a blank in column 9. The screen snapshot shown here looks messy, but try Filter for yourself. It's easy to use.
Moving right along are we. We’ve seen Freqs, had a bit of a flitter with Filter. We clamour for more. What else can Lertap show us? Quite a bit.