The ChartChangers

Contents
It's possible to make quite a number of changes to Lertap's quantile plots, or "charts".
An oft-used built-in option is a switch which turns on, or turns off, the data table from which the trace lines in the charts are derived. How to flick this switch? See the quintile options topic.
Packing the plots
The screen snapshot below indicates how "packing" the plots may lead to a useful gestalt, a condensed overview of item performance. This snapshot displays plots for the first twelve items from the MathsQuiz dataset:
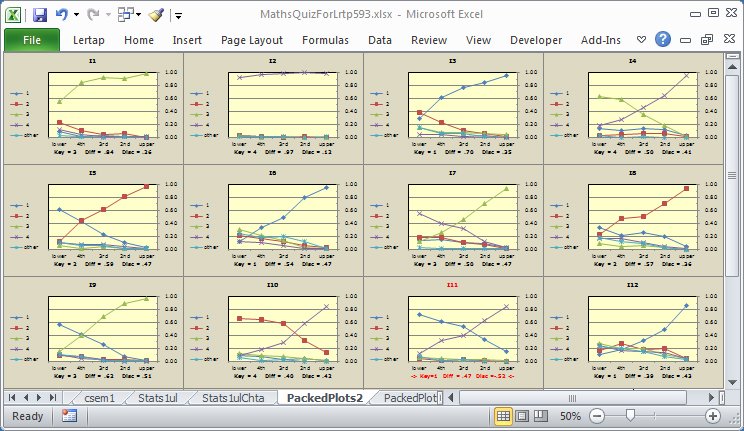
Note: items with negative discrimination ("disc.") are flagged in the plots by the use of red coloring. The item's label will be red, and the statistics below the chart will also be red. I11 is an example above. The "Disc." values in the charts are brought in from Statsb reports.
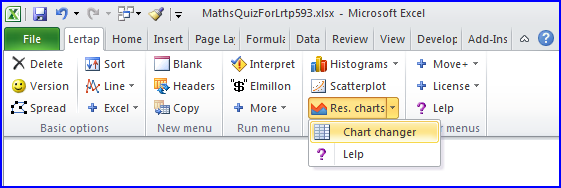
If you have Excel 2010, plot packing may very readily be accomplished with an in-built macro called ChartChanger3. It's activated by clicking on the small arrowhead next to the Res. charts option:
A special setting makes it possible to get normal quintile plots and ChartChanger3's packed plots with just a single click. This setting, and several others pertaining to the use of ChartChanger3, are described in the next topic (following page).
Another way to get packed plots is to use "ChartChanger2". Users with any version of Excel are able to use it, including those with Excel 2011 on a Macintosh. It's part of the set of macros found in the Lertap5MacroSetA.xlam file. This file is a standard Lertap component; when you start up Lertap, the file is automatically opened, and its macros are made ready for use by Excel and Lertap.
ChartChanger2 is not as simple to use as ChartChanger3, but it does have a bit more flexibility. It is accessed via the "Macs" menu; please refer to the Macs menu topic for more specific details on how to get it running.
Here's one example of what can be done by inviting ChartChanger2 to change the layout of a set of quintiles (these charts are based on the "MathQuiz" dataset):
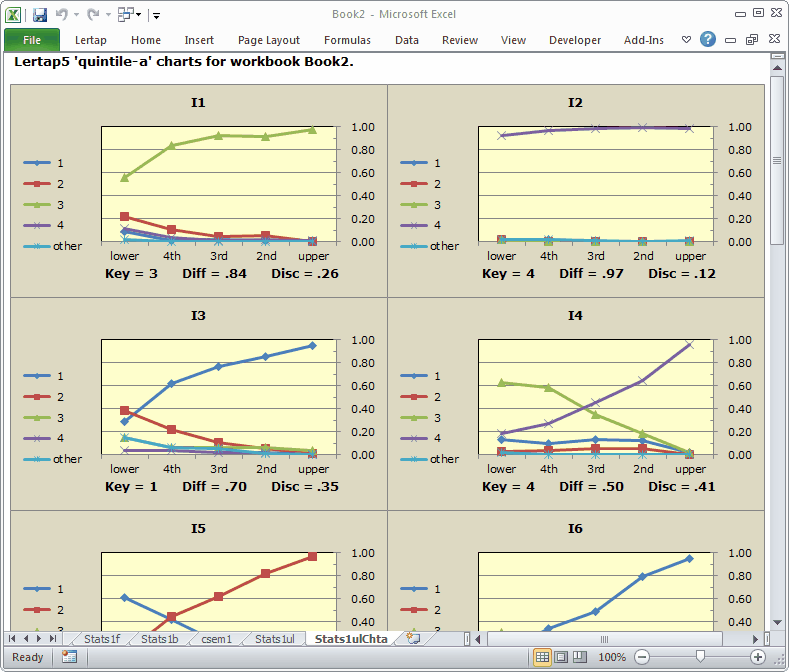
In this case, ChartChanger2 was directed to make a grid having two charts per row with no blank lines between the rows.
If you're using a large monitor with your computer, you could have four or five charts per row and end up with a display which quickly captures the performance of all test items. (A useful tool for an item-review session with colleagues.)
The ChartChanger2 macro makes it a simple matter to resize quintiles. In the example above, the charts were made with the Excel 2010 version of Lertap. The first quintile was reduced in size, the macro was run, and the display above was the result. The Excel 2007 version behaves the same way.
While we're talking about changing quintiles, why not take a minute to consider the matter of deleting some of the quintiles? If you'd like to delete a quintile, just right-click on it and select "Cut". Bingo -- it's gone.
But doing this, deleting a chart, will leave a hole or a gap in the display. Not to worry -- just run ChartChanger2 again.
We could also discuss how to use Excel to select all of the charts on any worksheet in one quick go: from the Excel 2007 or Excel 2010 Home tab, find and click on the "Find & Select" option. From the list which drops down, choose "Go to". In the wee dialog box which then displays, click on the "Special" button at the lower-left. Finally, from the larger dialog box which will pop up (or down), select "Objects" and click OK. (You can quick-start this process by using the F5 key at the top of your keyboard.)
What about printing quintiles? Read a how-to on printing, and gain more insights into using ChartChanger2 here, at this topic.