Conditional SEMs (csem1 report)

Contents
Your read of the Lertap manual will have made you full-bottle on the usual standard error of measurement, SEM, and the invaluable role it has to play in the interpretation of test scores.
The SEM commonly used in CTT, classical test theory, is an average figure, one very frequently applied to each and every student's test score as an estimate of measurement error, no matter the level of the score. It is found in the "Summary statistics" sections of Stats1f reports.
However, it has long been known that standard errors of measurement vary by ability. As we go from test takers with little proficiency, to those with average proficiency, and then on to the strongest students, respective SEMs change. To reflect this, Lertap also computes SEMs for various score levels using methods from a paper by Lord (1984). More exactly, Lertap employs Lord's Method III, the binomial error model, and also the adjustment to Method III estimates, known as Method IV.
A "csem1" Lertap report has two parts: a table followed by a plot. The information seen in the sample output below is from the "M.Nursing" dataset.
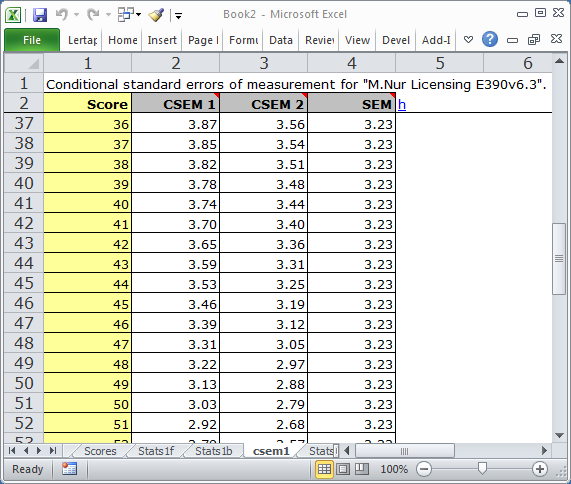

There are always three lines in the graphs. The flat one, the horizontal one, corresponds to the usual SEM value, as seen in Lertap's Statsf reports. The SEM value is a constant; it's the same for all test takers, no matter their ability.
The top line, a curve, corresponds to standard errors computed using the binomial error model, labeled as Method III in Lord (1984). The lower curve is what results when Method III estimates are adjusted using Method IV; Method IV estimates will be lower than Method III's whenever the items used in the subtest have different difficulties ("diff" values, to use the parlance of Lertap's Statsb reports).
So, what does the graph tell us?
In this case, results are from a 60-item mastery test with a cut score at 42 (equal to 70% of the maximum possible score of 60).
At the cut score, SEM was 3.23, as it was for all other levels. But the conditional standard errors of measurement at this point were greater: 3.36 using Method IV (CSEM2 in the graph), and 3.65 using Method III (CSEM1 in the graph); these CSEMs are a better reflection of the true state of affairs around the cut score of 42.
Related tidbits:
NCCA (the National Commission for Certifying Agencies) allows for reporting of the "standard error of measurement at the cut-score". Use CSEM2 for this, "Lord's Method IV".
Classical test theory, CTT, has frequently been criticized as failing to acknowledge that errors of measurement vary over score levels. This alleged "failure" is, in turn, often used to highlight an alleged advantage of item response theory, IRT. The criticism is largely misplaced; it is incorrect. CTT and IRT both provide for conditional measurement error estimates. Interestingly, IRT estimates of measurement error are lowest in the middle of the score distribution, rising to their highest values at the extremes. CTT estimates are the opposite; as illustrated in the chart above, CTT error estimates are greatest in the center. For more information, please refer to this paper.
There's a paper, another best seller, which has lots more about using cut scores, with several examples: www.lertap5.com/Documentation/JERM2007d.pdf.