Summary statistics

Contents
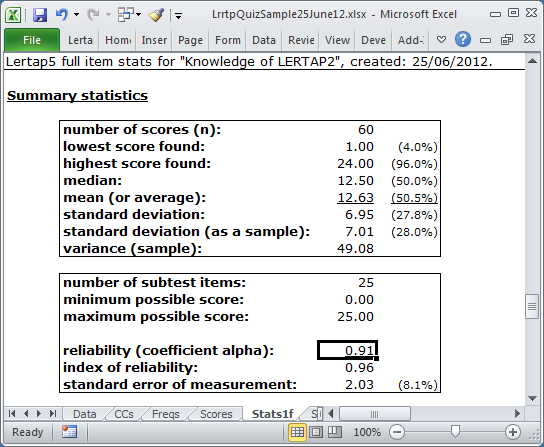
The "Summary statistics" section of a Statsf report consists of two small tables.
number of scores (n) |
This figure corresponds to the number of students whose item responses are found in the Data worksheet. Lertap creates a test score for each student when the Elmillon option is used. The actual test scores are found in the Scores worksheet. |
lowest score found |
Of all the scores, this figure is the lowest one found. The figure in parentheses, (4%) in this example, expresses the lowest score as a percentage of the maximum possible score. In this example, the maximum possible score was 25. |
highest score found |
The highest score found. The figure in parentheses, (96%) in this example, expresses this score as a percentage of the maximum possible score. |
median |
The score which corresponds to the 50th percentile. In this example, half of the scores are below 12.50 and half are above. |
mean |
The average of the test scores, also called the "mean" and the "arithmetic mean". The mean and the median will be equal when the scores are symmetric about the mean. |
standard deviation |
This is one measure of how spread out the scores are. If all the scores are the same, the standard deviation will be zero. If you are familiar with the equations used to calculate this statistic, Lertap uses the equation with "n" in the denominator to derive this figure. |
standard deviation |
If the students tested are considered to be a sample drawn from a larger population, an unbiased estimate of the population standard deviation is given by this figure. If you are familiar with the equations used to calculate the standard deviation, Lertap uses the equation with "n-1" in the denominator to derive this value. |
variance (sample) |
The square of the standard deviation (sample). Another measure of how spread out the scores are. |
number of subtest items |
This is the number of items in the test (or subtest). |
minimum possible score |
Corresponds to the lowest possible score which a student could get on the test. For a cognitive test, this is usually zero, meaning no items correct. |
maximum possible score |
The highest possible test score. On a cognitive test this is usually equal to the number of test items, with a student getting one point for each item answered correctly. |
reliability (coefficient alpha) |
Derived by applying Cronbach's method to find coefficient alpha. The maximum possible value is 1.00. A "good" cognitive test might be expected to have a reliability of at least 0.80; a "good" affective scale might be expected to have a reliability of at least 0.70. Note (however), that these "good" values are not always appropriate. A "mastery" test, for example, will sometimes be acceptable even when its reliability, as measured by alpha, is low. Affective scales frequently have alpha reliabilities below 0.70 -- when this happens, results are often interpreted on an item by item basis instead of the overall scale score. |
index of reliability |
In "CTT", classical test theory, this is the correlation between observed scores and true scores. It is computed by finding the square root of the reliability estimate. |
standard error of measurement |
Often abbreviated as "SEM", this is a measure of measurement precision, inversely related to reliability. Very reliable tests will have little measurement error. The SEM is often used to form "confidence intervals". Adding and subtracting one SEM from any test score gives what is often called the "68% confidence interval", a range of scores which, given certain assumptions, captures the true test score with a probability of 0.68. In CTT, SEM is an average figure. A more accurate estimate of measurement error is found by computing the "conditional standard error of measurement", a figure which varies by test score. Lertap's "csem" report provides estimates of measurement error by test score. |
Related tidbits:
To see how Lertap can be used to calculate split-half reliability estimates, have a go with the "HalfTime" dataset.
Lertap will also compute an estimate of McDonald's omega reliability estimate. See the last section in this document.
An example of equivalent-forms reliability (also known as parallel forms reliability) may be seen here.
KR-20 and KR-21 are reliability estimates stemming from the work of Kuder and Richardson (1937). KR-20 and coefficient alpha will be equal when all of the test's items are scored on a right-wrong (or "dichotomous") basis, which is common for a cognitive test. When one or more of a test's items have more than one correct answer, or when an affective scale is in use, then "polytomous" scoring is in effect and coefficient alpha is the preferred estimate of reliability.
Some third-party accreditation bodies, such as NCCA (the National Commission for Certifying Agencies), will explicitly request the value of KR-20 for a test. If your test items are all dichotomous, scored on a right-wrong basis, then write in the value of coefficient alpha for KR-20 (they're the same in this case). If one or more of the test items has/have more than one right answer, then write in the value of coefficient alpha and indicate on the form that alpha has been used as KR-20 was not appropriate. (More about linking Lertap's statistics to NCCA reports is covered in this little paper.)
KR-21 is a simplified form of KR-20, used in the very rare case when all items have the same difficulty (in other words, it's not much used at all -- in its day it was a computational shortcut to KR-20).