Steps
Take the program for a test drive by doing these things.
(1) Get a suitable dataset to use, one having cognitive items (e.g. multiple choice items)
Note1: only 100 or so data records are needed for a test run - if the dataset has more, get into the Data worksheet and insert a new row after record 102 or thereabouts - whenever Lertap encounters an empty row in the Data sheet it thinks it has come to the end of the records. You would insert after row 102 because row 102 has the 100th data record; the first two rows in the Data sheet are "headers".
(2) Run the "Interpret" option
This will produce the Freqs report.
(3) Run the "Elmillon" option
This makes the Stats reports, Stats1f, Stats1b, Stats1ul.
(4) Run the "Item scores and correlations" option from the Run menu
It makes an IStats worksheet.
(5) Select the RaschAnalysis1 option from the Run menu
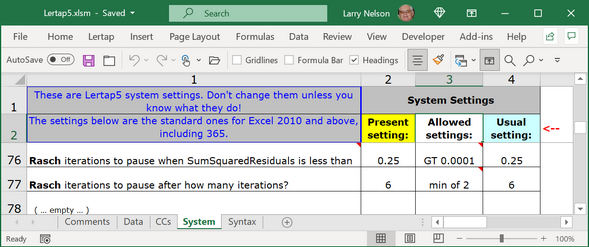
How it works: the program follows joint maximum likelihood iteration steps much as exemplified by Moulton. Two settings in Rows 76 and 77 of Lertap5's System worksheet provide pausing rules:

When one of the two conditions in rows 76 and 77 is met, the program pauses its automatic iterations and asks users what to do next: stop iterating, or continue. The conditions may be changed by entering new values under the "Present setting" column; if this is done, the Lertap5.xlsm workbook (the main workbook, the one that's always open) should be saved so that the settings are preserved.
As the program steams along it provides feedback in the status bar at the bottom of the Excel screen, indicating the "SumSqrdResiduals" at the end of each iteration. This value will (should) decrease steadily, usually getting very close to zero after 5 or 6 iterations. Note that Excel uses exponential formatting as numbers get very small. A figure such as 0.3062 E-02, for example, would mean 0.003062 (should a value such as this appear there would be no need to ask the program to continue iterations -- the objective is to iterate until Sum is, say, less than .5 or so).
