Mastery mode

Contents
"Mastery mode" refers to the situation where some sort of cutoff score has been used to classify test scores into, for example, "masters" and "non-masters", or "pass" and "fail", or "promote" and "keep back".
The cutoff score is at times referred to as a "criterion", as in "CRT", criterion-referenced testing.
Lertap's mastery mode is activated by using the word "Mastery" in a CCs *sub line, as seen here:
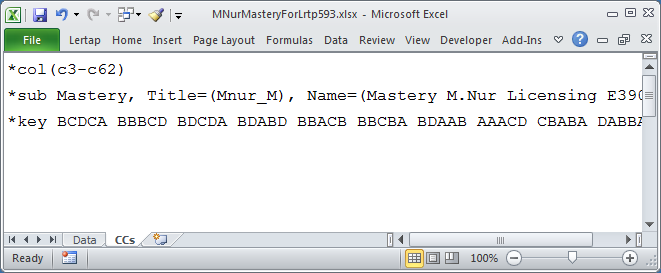
Lertap's mastery level is usually set at 70%. Test scores at and above this level make it into Lertap's "masters" group, while the rest go into a group called "others". It is possible to change the mastery level by using, for example, Mastery=80% on the *sub line, or by changing the default setting in row 11 of Lertap's System worksheet.
With the release of version 5.10.5.1 in early 2015, it became possible to use a raw test score for the Mastery setting: Mastery=40, for example, will set the cutoff score at 40 -- in a test with 60 items, this would usually be equivalent to Mastery=67% (assuming each item has just one correct answer worth one point).
Note that prior to version 5.10.5.1, Mastery=X always meant X%. This is no longer the case; if the % sign is not used, Lertap will interpret X as a raw test score. But, this does not apply to the setting in row 11 of the System worksheet: a value in row 11 will always be interpreted as percentage figure. In order to use a raw test score as a cutoff, a Mastery= assignment has to be made on the *sub card; this is an example of setting the cutoff to a raw test score of 40:
*sub Mastery=40, Title=(MyTest1), Res=(1,2,3,4)
This will set the mastery level to 40% of the maximum possible test score:
*sub Mastery=40%, Title=(MyTest1), Res=(1,2,3,4)
In the line below, since there is no = sign, Lertap will look to row 11 in the System worksheet to get its mastery cutoff setting, and it will always be a % figure.
*sub Mastery, Title=(MyTest1), Res=(1,2,3,4)
Critical note: when using a Mastery= setting, as opposed to just the word Mastery by itself, it's advisable to keep the Mastery= setting from being the last entry on the *sub line, especially when Wt= is also used on the line. (Wt= is an assignment which controls the weight given to a subtest when it enters the total score composite, something which is relevant when there's more than one subtest. Wt= assignments should be the last entry on a *sub line. Read a bit more about this by looking at Example C6 in this topic.)
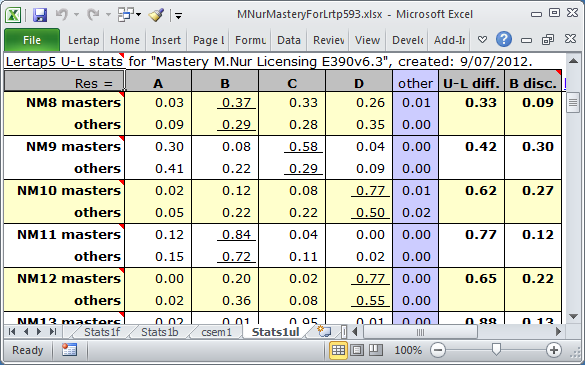
The Stats1ul report in mastery mode looks like the snapshot above. With one exception, the statistics which appear are the same as the those found when a mastery level is not used (previous topic). The exception is the last column, "B disc", named after Brennan (1972), who referred to it as "a generalized upper-lower discrimination index". It is simply the difference in the proportions for the correct answer. Unlike the U-L disc value encountered in a regular Stats1ul report, the B disc value for an item depends on the where the cutoff level is -- it would change if, for example, we used 80% as the cutoff instead of 70%.
(Note: there is a slight difference in the way the U-L diff value is calculated when a mastery level is used; students who do not answer an item, or have an invalid response, are excluded from the calculation for that item.)
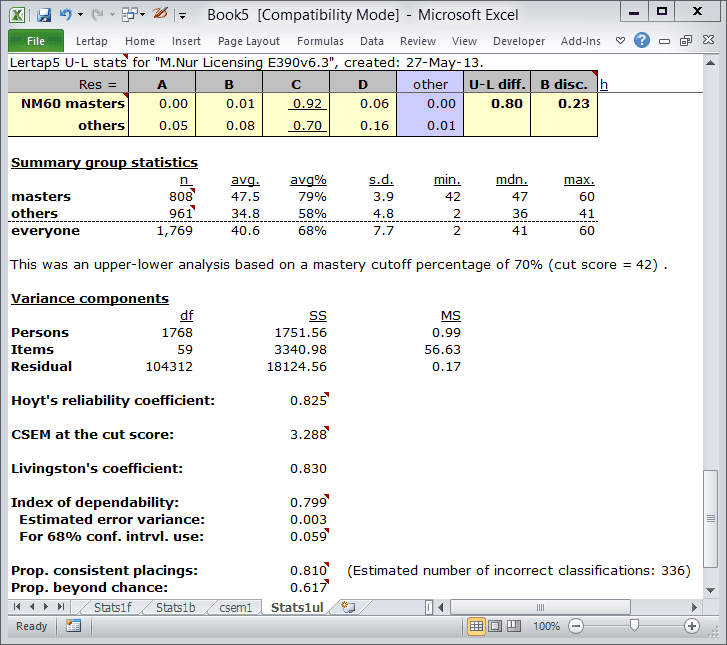
The bottom of a Stats1ul report when a mastery level is in use includes the extra information seen here under the "Variance components" section. This information has to do with assessing how well a mastery test has worked. If a mastery test could be used twice to classify students as "masters" or "others", we would hope that the classification of each student would be the same on each testing, that there would be perfect "agreement" from one testing to the next. However, the measurement error commonly associated with our tests makes this highly unlikely.
Hoyt's reliability coefficient |
This reliability estimate comes from the work of Hoyt (1941); he showed how test reliability could be estimated from a variance components table. It is well known that Hoyt's procedure produces the same result at that found by computing Cronbach's coefficient alpha. (Compare Hoyt's estimate with the "reliability (coefficient alpha)" figure found in the Stats1f report -- they'll be equal.) |
CSEM at the cut score |
The standard error of measurement at the cut score. The "C" in CSEM means "conditional" as the value of CSEM depends on, or is "conditioned on", test score. (In this case the cutoff percentage is 70%, equal to a cut score of 42. The value seen here is brought in from the appropriate row in the CSEM 2 column of the csem1 report.) |
Livingston's coefficient |
An "agreement index" based on a squared-error loss function. Berk (1980) regards this as "providing meaningful information about the consistency of scores in relation to the cutting score". When the cut score is equal to the mean test score, Livingston's coefficient will equal the value of coefficient alpha (and Hoyt's coefficient). |
Index of dependability |
This agreement index stems from the work of Brennan and Kane (1977). It is also based on a squared-error loss function; unlike Livingston's coefficient, this index takes into account item variance. If all items have the same difficulty it'll be equal to Livingston, otherwise it will be lower than Livingston's coefficient. Because of its incorporation of item variance, this index is sometimes preferred to Livingston's (see Crocker and Algina, 1986). |
Estimated error variance |
Derived from the work of Brennan and Kane (1977). They referred to this statistic as the "estimated error variance for making decisions about individual persons", specifically noting its relevance to mastery testing. |
For 68% conf. intrvl. use |
To develop a range which might be expected to capture a student's "universe score" 68% of the time, add and subtract this figure from a student's test score (with the test score expressed as a proportion of the maximum possible test score). "Conf. intrvl" means "confidence interval". |
Prop. consistent placings |
Berk (2000) regards this statistic, the estimated proportion of students who would be consistently classified, or placed, by using a test as a "Best Buy", referring to it as "an unbiased estimate of decision consistency which is easy to compute, interpret, and explain". (Berk implies it is generally much preferred to Livingston's coefficient, and to Brennan and Kane's index of dependability.) |
Prop. beyond chance |
This is "kappa", a well-known estimate of the proportion of students who have been correctly classified above and beyond those who would be so classified by chance alone. Berk (2000) suggested that kappa "is a biased estimate with a long list of limitations and statistical conditions that complicate its interpretation". |
Note that it is possible for a test to have low reliability, but still have good classification consistency. Some examples of such tests are shown here.
Related tidbits:
NCCA (the National Commission for Certifying Agencies) allows for "decision consistency" estimates to be reported for a test, instead of a conventional reliability estimate (such as coefficient alpha or KR-20). Four of Lertap's statistics could be used as the decision consistency estimate: (1) Livingston's coefficient; (2) the "Index of dependability"; (3) the "Prop. consistent placings" (the p0 index), and (4) the "Prop. beyond chance" (kappa). Which of these four should be reported for NCCA? The p0 index might be the best bet, with, perhaps, the "Index of dependability" tagging along. How to use Lertap's output to complete an NCCA report? Got it covered. Where? Here.
Read more about these statistics in Chapters 7 and 10 of the manual, and (especially) in a not-overly-boring paper discussing the use of cutoff scores and many of the statistics seen in this topic, by clicking here.
The citations seen above may be followed here: Get those refs!.