The csem1 plot

Contents
csem stands for "conditional standard error of measurement".
A test administration whose reliability estimate is less than 1.00, less than perfect, has measurement error. Were we able to test the same students again, with the same items, trusting there to be no memory effect (students will not remember having seen the items before), student scores can be expected to change. Our testing is fallible. If it weren't, the reliability coefficient would be 1.00. (Ours is a paltry 0.68 in this example.)
Let's say we took a single student, and tested him or her repeatedly (an almost infinite number of times, say) with the same test. Again assuming there to be no memory effect, and acknowledging that the test is fallible, there will be a distribution of test scores for our student. Each of these test scores is referred to as an "observed score".
In classical test theory, CTT, the mean of the observed scores is the "true score", the score which would be expected if the test administration were perfectly reliable.
The standard deviation of the observed scores is SEM, the standard error of measurement.
For our little MathsQuiz, Lertap's Stats1f report says that the standard error of measurement is 1.63, or 10.8 on a percentage-correct scale.
Your read of the Lertap manual will have made you full-bottle on the usual standard error of measurement, SEM, and the invaluable role it has to play in the interpretation of cognitive test scores. (See especially Chapter 7 of the manual; also see the tidbit below.)
Now, it has long been known that standard errors of measurement vary by ability. As we go from test takers with little proficiency, to those with average proficiency, and then on to the strongest students, respective SEMs change. The SEM commonly used in CTT is but an average figure, and, until 2006, it was the only measurement error estimate provided by Lertap.
These days Lertap computes SEMs for various score levels using methods from a paper by Lord (1984). More exactly, Lertap employs Lord's Method III, the binomial error model, and also the adjustment to Method III estimates, known as Method IV. These SEMs are called "conditional" SEMs as they vary, depending on true score levels.
Have a look at an example of Lertap output for CSEMs:
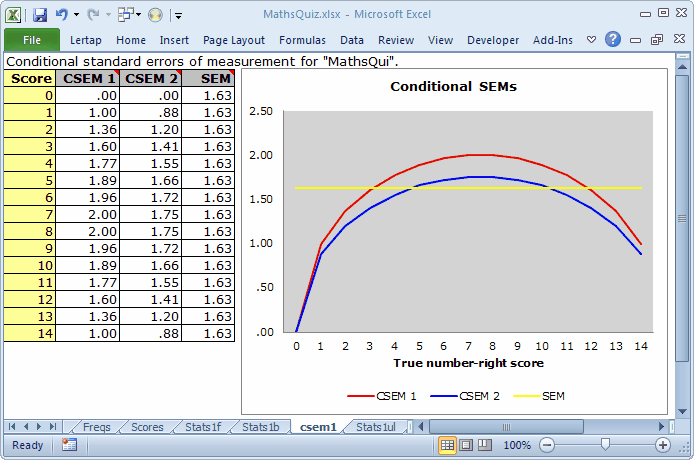
Charts such as this one will be found on worksheets with catchy labels of "csem1", "csem2", and so on. They are automatically computed whenever a cognitive subtest is found to have used number-right scoring, which is the most common type of scoring.
There are always three lines in these graphs. The flat one, the horizontal one, corresponds to the usual SEM value, as seen in Lertap's Stats1f reports. The SEM value is a constant; it's the same for all test takers, no matter their ability.
The top line, a curve, corresponds to standard errors computed using the binomial error model, labeled as Method III in Lord (1984). The lower curve is what results when Method III estimates are adjusted using Method IV; Method IV estimates will be lower than Method III's whenever the items used in the subtest have different difficulties ("diff" values, to use the parlance of Lertap's Statsb reports).
So: what's the graph tell us?
Consider those applicants with a true number-right score of 7 (just under 50% of the maximum possible test score of 15). The usual SEM at this score level was 1.63, as it was for all other levels. But the conditional standard errors of measurement at this point were greater: 2.00 using Method IV, and 1.75 using Method III; these CSEMs are a better reflection of the true state of affairs in the center of the score range -- errors of measurement are highest here, falling away as we move left or right to the extremes.
CSEMs will have special relevance when cut scores are used, for example, as in setting pass-fail points. For the test pictured above, we'd want to acknowledge greater measurement imprecision for scores near the middle, while at the same time having reason to believe that we have less error when it comes to testing the best students, and the weakest. (To be noted is the relationship between reliability and SEM. As reliability increases, SEM decreases. It would be interesting, would it not?, to see what would happen to these SEMs were we to correct I11's miskey; this is left as an exercise for you.)
Tidbits:
There's a paper which has lots more about measurement error, and the use of cut scores, with several compelling examples. Read all about it.
CSEM curves have an inverted U shape, opposite to the curve found in IRT, item response theory. In IRT, measurement precision is generally greater around the average score, and much less at the extremes, giving rise to a curve which dips in the middle, and goes up at either end (a U shape). Take in another paper by clicking here.