
| Home | |
| Quicklinks | |
| Introduction | |
| Overview | |
| Class quiz | |
| CEQ survey | |
| Entrance exam | |
| Lertap quiz | |
| Documentation | |
| Software | |
| Classes | |
| Reviews | |
| History | |
| References | |
| Contact us | |
We should all have principalsA university lecturer, interested in the attitudes of high school principals towards the use of computers, applied a survey originally developed in the 1980s by MECC, the Minnesota Educational Computing Consortium. The survey had a total of ten "questions", or items. All items were of the Likert style, asking people to circle 1 if they strongly disagreed with the item's stem; 2 if they disagreed; 3 if they were undecided; 4 if they agreed; and 5 if they strongly agreed. Four of the ten items are shown below. The "polarity" of the item stems was either positive or negative. Items (1) and (2), as seen below, had positive stems— their lead-in statements (the stems) were positively phrased. Items (4) and (6), on the other hand, used negative stems.
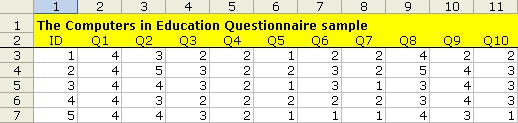
Twelve high school principals in a southern New Zealand city provided anonymous responses to the survey. Their item responses were entered into an Excel worksheet; the responses of the first five principals are shown in the little snapshot below:
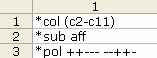
In order to get Lertap to process the principals' responses, a few lines of coded instructions are required— in this case, three lines of "code" were entered in an Excel worksheet:
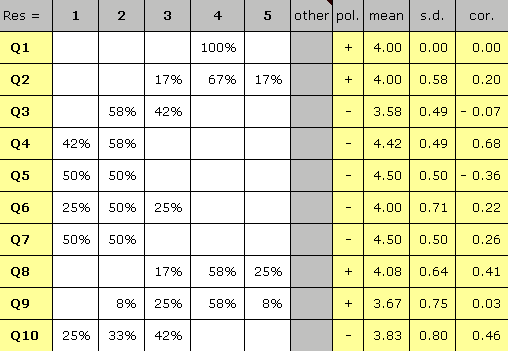
These lines tell Lertap that (1) item responses are found in columns 2 through 11 of the data worksheet, and (2) that the items are affective in nature. The last line, (3), indicates the polarity of the item stems— there's one plus or minus sign for each of the survey's ten items (a space has been used so that the polarity signs are grouped by 5s). A Lertap summary of the principals' responses is shown here:
The statistics in the last three columns of the table above have been adjusted so as to take into account item polarities. The statistics were derived by associating a certain number of scoring points for each possible item response. For the positive items, a response of 1 was equated to 1 scoring point; 2 = 2 points; ...; 5 = 5 points. The negative items were scored in a reverse manner: a response of 1 was equated to 5 points; a response of 2 to 4 points; ...; and a response of 5 to 1 point. This item scoring method means (as it were) that we can look at the item means and know that the closer they are to 5, the closer the principals came to giving a positive response to the item. (In essence, what we're saying is that a negative response to a negative question is a positive outcome.)
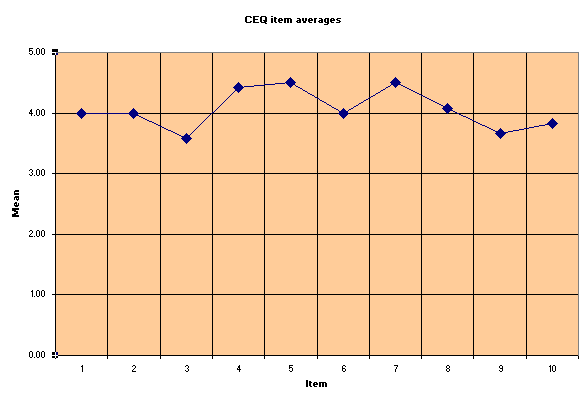
Here's a Lertap / Excel plot of the item means:
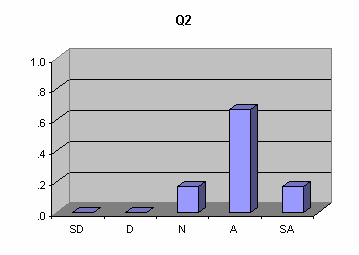
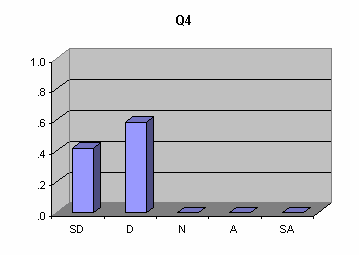
Bar charts of responses are easy to get; below we've displayed a couple:
This page has featured selected snippets of Lertap's output for the survey— other information was also produced by Lertap, such as an index of the reliability of the survey scores. More samples of Lertap reports and graphs may be found in Chapter 2 of the manual. The graphs produced by Lertap are really all made by Excel. In some cases, such as histograms, bar charts, and scatterplots, Lertap offers shortcuts to Excel's extensive charting options, and pre-formats the charts so that little user intervention is required. In all cases, the charts produced may be reformatted, the colours may be changed, new titles added, and axes relabeled. Copying Lertap's graphs to other applications, such as Word and PowerPoint, is, as you might well expect, straightforward, following standard copy-and-paste actions.
|
|||||||||||||||||||||||||||||||||||||||||||||||||||||||||||||||||
![]()
To report errors on this website please e-mail: Faculty
of Education, Language Studies, and Social Work
Curtin University of Technology, Perth CRICOS Provider Code 00301J
The Sydney Campus of Curtin University of Technology CRICOS Provider Code
02637B
Copyright
and Disclaimer
Last modified
May 13, 2005