| Home | |
| Quicklinks | |
| Introduction | |
| Overview | |
| Class quiz | |
| CEQ survey | |
| Entrance exam | |
| Lertap quiz | |
| Documentation | |
| Software | |
| Classes | |
| Reviews | |
| History | |
| References | |
| Contact us | |
Up and atomA high school teacher developed a quiz on the atomic table, with ten multiple-choice cognitive questions. She got the students in her Year 9 Chemistry class to take the quiz. Each question had four options, A, B, C, and D. She wisely opted to process quiz results using Lertap 5. Question answers for all fifteen students were typed into an Excel worksheet. The screen snapshot below displays the answers given by the first five students.
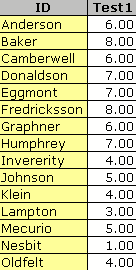
The teacher put the keyed-correct answers to the questions into Excel, and then asked Lertap to produce results. One of Lertap's standard reports is Scores, a table with student quiz results:
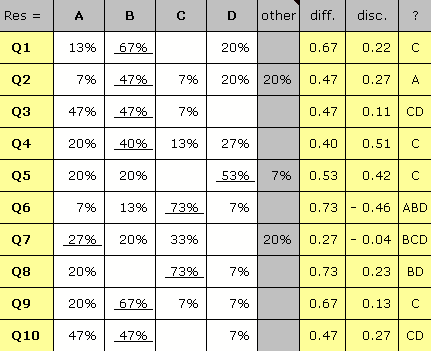
Another standard Lertap report summarises how the students answered the items. In the table below, the keyed-correct answer to an item has its results underlined. For example, the keyed-correct answer to the first quiz question, Q1, was B.
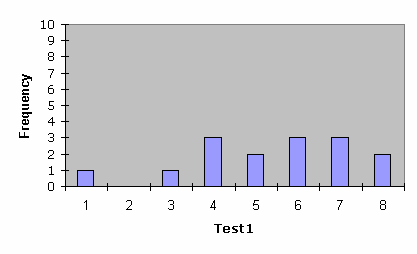
The table above indicates the percentage of students selecting each question option. The "other" column has an entry if some students did not answer an item. The "diff." column indicates item difficulty, the "disc." column item discrimination, while the "?" column has entries which indicate item options which would seem to require the teacher's attention. (Note that it's sometimes the case that Lertap users will ignore the diff., disc., and ? columns, finding all they want to know about student responses in the percentages found in the first columns.) A simple histogram of quiz scores is shown below (as made by Lertap):
We haven't shown all of Lertap's output for this example— less than a fifth of it, in fact. Many more sample snapshots of Lertap output may be found in Chapter 2 of the manual.
|


