| Home | |
| Quicklinks | |
| Introduction | |
| Overview | |
| Class quiz | |
| CEQ survey | |
| Entrance exam | |
| Lertap quiz | |
| Documentation | |
| Software | |
| Classes | |
| Reviews | |
| History | |
| References | |
| Contact us | |
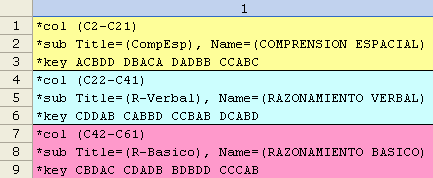
Let us entrance youOur history page will tell you that Lertap was born in Caracas, Venezuela. Venezuela's largest university, la Universidad Central de Venezuela, UCV, has long been a very active Lertap site. A pilot entrance exam developed by the engineering faculty in the mid 1990s consisted of sixty multiple-choice items, comprised of three subtests, each with twenty items. The table below displays the Lertap control code developed to process the pilot:
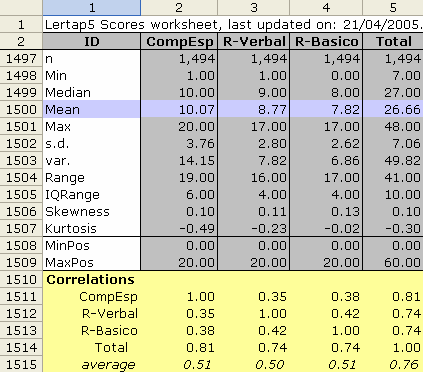
The nine lines above set out the three subtests. The twenty items of the "Comprension espacial" subtest are found in columns 2 through 21 of the data worksheet, followed by the twenty items for "Razonamiento verbal" in columns 22 to 41, and followed, finally, by the twenty "Razonamiento basico" items in columns 42 through 61. The three *key lines indicate the keyed-correct answers for the items. Each *key line has twenty keys, grouped in 5s. The *sub lines provide labels which make it easier to interpret Lertap's reports. One of these reports is called Scores. It consists of one line of scores for each test taker, followed by a table of score statistics. The snapshot below shows what the stats look like:
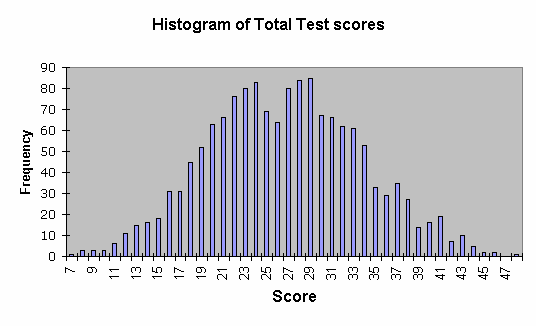
Lertap has made a "Total" test score. In this case, Total is the simple sum of the three unweighted subtest scores. A histogram of these scores is seen here:
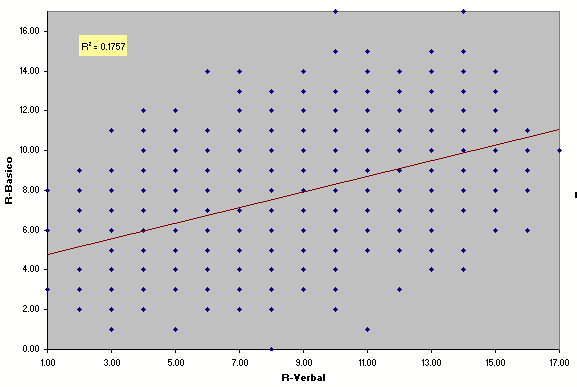
The correlations among the subtests are not high. The scatterplot below confirms the lack of a linear relationship between the two reasoning subtests (note how far the points fall from the regression line, and the low value of R squared).
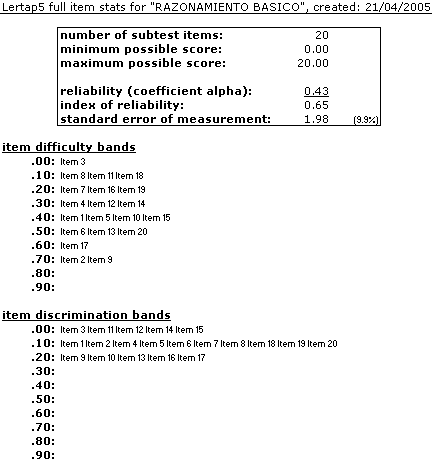
If you're accustomed to looking at test results, your review of the statistics seen at bottom of the Scores report (above) may lead you to conclude that the pilot test was difficult. The subtest means are on the low side— the maximum possible score on each subtest was 20; the maximum possible Total score was 60. The means shown in the table are, with one exception, less than 50% of the maximum possible score. Look at a selection from Lertap's Stats3f report for a minute, okay?
The reliability of the Razonamiento Basico pilot subtest was very low (0.43). The two "bands" tables show that seven of the items had difficulty indices less than .30, while all but five items had discrimination values below .20. The Lertap scatterplot below provides the same information in pictorial form. These are bleak results for an entrance exam meant to discriminate strong students from weaker ones, as Lertap's manual points out in its latter chapters. Once again we haven't shown all of Lertap's output for this example. We have, in particular, not presented examples of the detailed item statistics found in Lertap's "full stats" reports. Chapter 2 of the manual has some, and there's also a screen snapshot or two in one of the gobsmackers. Nor have we looked at Lertap's two styles of quintile plots, graphs which can be useful when trying to determine why items haven't worked well— Lelp's quintile plots topic has some examples of these, and they might impress you.
|
